
Amazon (AMZN) - Fundamental Analysis Report 2026 (Updated)

Dear Readers, Welcome to Deep Research Global.
Let’s analyze the topic in detail.
Executive TL;DR
Amazon (AMZN) closed FY2025 with $716.9 billion in net sales and posted a record Q1 2026 revenue of $181.5 billion, up 17% year-over-year, with AWS growing 28% to $37.6 billion (its highest growth rate in 15 quarters).
The AWS commercial backlog hit $364 billion, up 93% year-over-year, signaling multi-year visibility into cloud demand, while total remaining performance obligations approached $627 billion.
Free cash flow has collapsed from $25.9 billion to $1.2 billion on a TTM basis, reflecting historic AI capex (an estimated $125 to $145 billion in 2026), the central tension of the entire investment debate.
Advertising is a quietly emerging crown jewel at over $70 billion annualized; the bull case rests on AWS reacceleration, advertising compounding, and capex normalization producing a free cash flow inflection in 2027 to 2028.
Table of Contents
Executive TL;DR
Introduction
Amazon Company Profile: Key Facts
Amazon Investment Thesis
The Three Engines Driving the Long-Term Thesis
What Makes the Thesis Different in 2026
Amazon Business Model Overview
The Five Pillars of the Business Model
Geographical Footprint
Amazon Revenue Analysis
Top-Line Trajectory: 2021 to Q1 2026
Revenue Concentration and Diversification
The Reacceleration Signal
Latest Quarterly Earnings: Q1 2026 Deep Dive
Top-Line and Bottom-Line Beat
Segment Performance: All Three Engines Firing
Q2 2026 Guidance
Margins and Earnings Quality
Operating Margin Trajectory
Earnings Quality Considerations
EPS Trajectory
Cash Flow Mechanics: The Heart of the Bear Case
Operating Cash Flow vs. Free Cash Flow
How Investors Should Think About the FCF Compression
The Backlog Argument
Balance Sheet Health
Cash, Debt, and Liquidity
Working Capital and Inventory Discipline
Debt Capacity for the AI Cycle
Segment-by-Segment Teardown
Segment 1: Amazon Web Services (AWS)
AWS Revenue and Margin Profile
AWS Competitive Position
Trainium, Project Rainier, and Anthropic
Why the Backlog Matters
Segment 2: North America
North America Revenue and Profit Profile
Regional Fulfillment and Same-Day Delivery
Third-Party Sellers and Marketplace Services
Segment 3: International
International Revenue and Profitability
Geographic Drivers
Amazon’s Advertising Business: The Quiet Crown Jewel
Advertising Revenue Trajectory
What Drives the Advertising Engine
Advertising as a Margin Lever
Strategic and Competitive Context
Cloud Competition: AWS vs. Azure vs. GCP
Retail Competition: Amazon vs. Walmart vs. Shopify
Advertising Competition: Amazon vs. Google vs. Meta
Strategic Bets: Project Kuiper (Amazon Leo), Zoox, Anthropic
Valuation Framework
P/E and EV/EBITDA Multiples
Sum-of-the-Parts Approach
Free Cash Flow Multiples
Bull, Base, and Bear Case Scenario Analysis
Bull Case (Probability Weight: 30%)
Base Case (Probability Weight: 45%)
Bear Case (Probability Weight: 25%)
Key Risks
Risk 1
Risk 2
Risk 3
Risk 4
Risk 5
Catalysts to Watch
Catalyst 1
Catalyst 2
Catalyst 3
Catalyst 4
Catalyst 5
Catalyst 6
Prime and Subscription Services Deep Dive
Prime Membership Trajectory
What Prime Buys for Amazon
Amazon’s AI Strategy: Rufus, Alexa+, and Generative AI Reinvention
Consumer AI: Rufus, Alexa+, and Nova
Enterprise AI: Bedrock, AgentCore, and Q
Whole Foods, Amazon Pharmacy, and the Physical Footprint Strategy
Whole Foods and the One Grocery Strategy
Amazon Pharmacy
Capital Allocation and Shareholder Returns
Buyback Program
Reinvestment as Capital Allocation
My Final Thoughts
Analyst Price Targets
Official Sources and Data
Disclaimer: This analysis is for informational & educational purposes only and should not be construed as investment advice. Investors should conduct their own due diligence and consult with their personal financial advisors before making investment decisions. Past performance does not guarantee future results.
Introduction
For the first time since the 2022 sell-off, the Amazon investment story has split clean down the middle.
One camp sees the largest infrastructure build-out in commercial history producing a multi-decade compounding engine.
The other sees a balance sheet stretched on a thesis that demands almost flawless execution against Microsoft Azure, Google Cloud, and an army of “neoclouds.”
The Q1 2026 print did not settle the debate so much as raise the stakes.
AWS reaccelerated to 28% growth, the cloud backlog nearly doubled, and yet free cash flow fell to $1.2 billion on a trailing twelve-month basis.
This report unpacks every layer of that contradiction.
Amazon Company Profile: Key Facts
Amazon.com, Inc. is a Seattle-based diversified technology and consumer company founded in 1994 by Jeff Bezos.
The company is currently led by CEO Andy Jassy, with Bezos remaining as Executive Chair. As of May 20, 2026, AMZN closed at $265.01, placing the market capitalization near $2.85 trillion, which ranks Amazon as one of the five most valuable companies in the world.
Ticker:                 AMZN (NASDAQ)
Sector:                 Consumer Discretionary / Tech
CEO:                    Andy Jassy (since 2021)
Founded:                July 5, 1994
Headquarters:           Seattle, Washington
FY2025 Net Sales:       $716.9 billion
FY2025 Operating Inc.:  $80.0 billion
FY2025 Net Income:      $77.7 billion
TTM Revenue (Q1'26):    $742.8 billion
Employees:              ~1,576,000 (Dec 31, 2025)
Market Cap (May 2026): ~$2.85 trillionThe workforce totals approximately 1,576,000 employees as of year-end 2025, making Amazon the second-largest private employer in the United States. The corporate structure runs across three reporting segments: North America, International, and Amazon Web Services (AWS).
Amazon Investment Thesis
The investment case for Amazon in 2026 is not the same case it was in 2022 or even 2024.
The mix has shifted decisively toward higher-margin, scale-leveraged businesses such as AWS, advertising, and third-party services, while the retail engine has been re-architected around regionalized fulfillment.
The Three Engines Driving the Long-Term Thesis
The first engine is AWS, which generated $128.7 billion in 2025 revenue at a 38.1% full-year operating margin.
The Q1 2026 reacceleration to 28% growth combined with $364 billion in contractual backlog implies AWS could pace toward $200 billion in annual revenue within roughly two years if current trajectories hold.
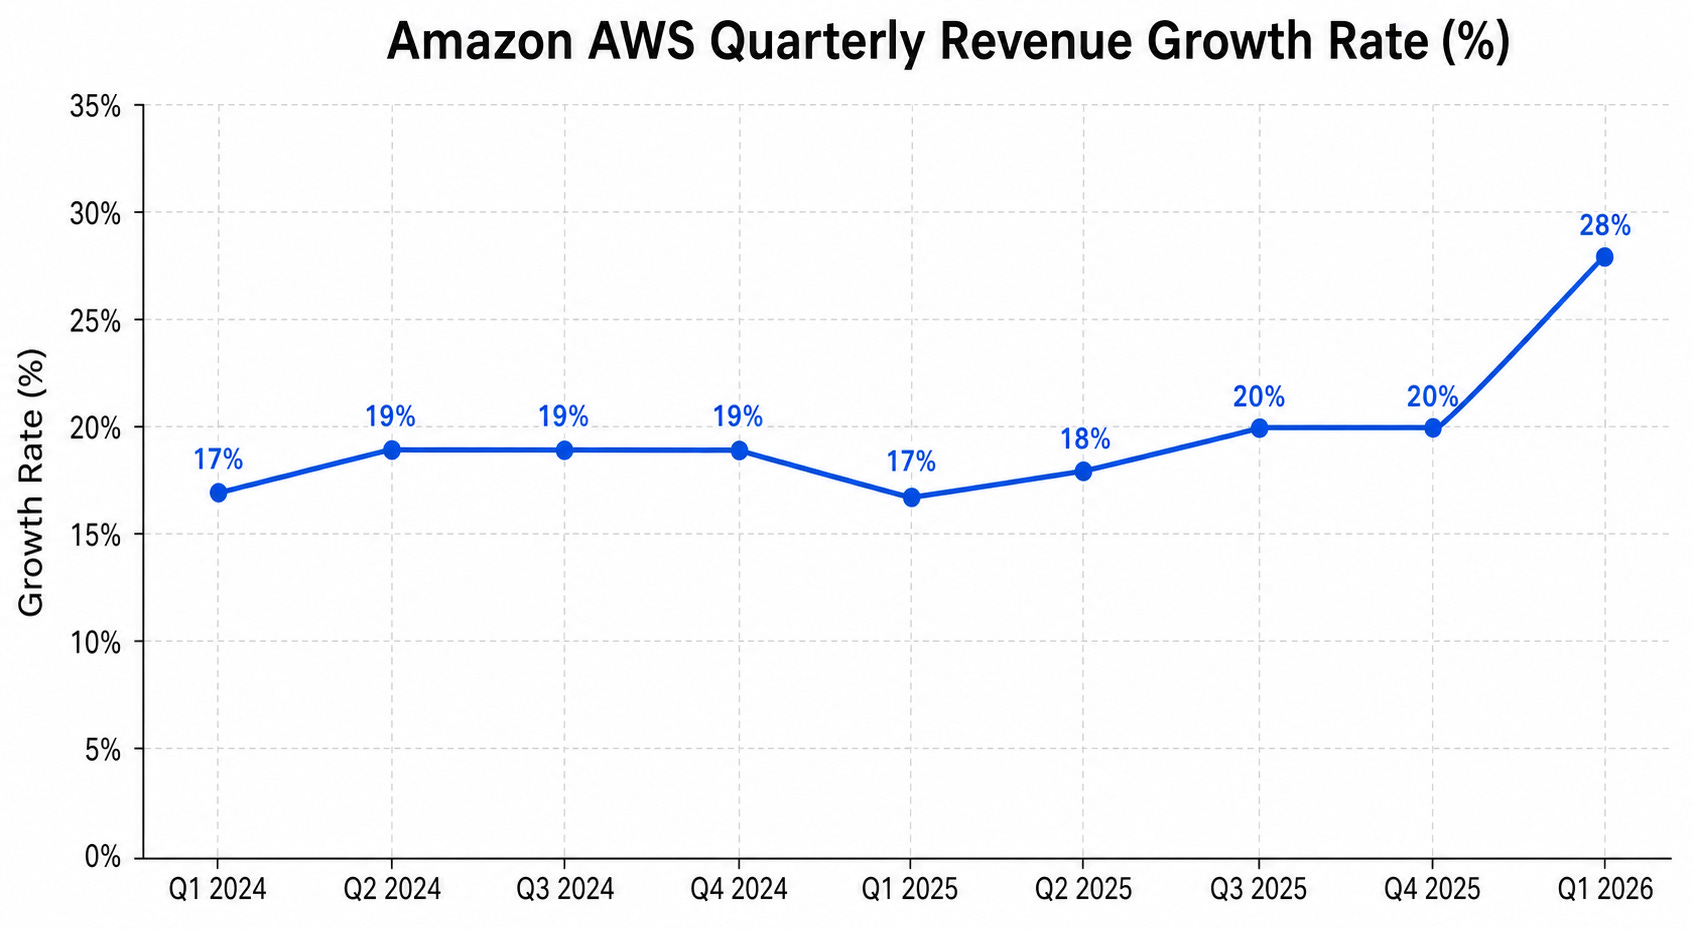
Image source: Deep Research Global analysis, based on Amazon quarterly earnings releases
The second engine is advertising, which crossed $68 billion in 2025 and reached $17.2 billion in Q1 2026 alone (a 22% year-over-year increase). Advertising margins are widely understood to be significantly higher than retail margins and are increasingly tied to closed-loop attribution against Prime Video, sponsored search, and Twitch inventory.
The third engine is the retail flywheel itself, which compounds through Prime, third-party seller services, subscription revenue, and a redesigned same-day delivery network.
The North America segment delivered operating income of $8.3 billion in Q1 2026, versus $5.8 billion in Q1 2025, reflecting durable operating leverage as the regional fulfillment redesign matures.
THE THREE ENGINES (Q1 2026 SNAPSHOT)
------------------------------------------------
AWS:           $37.6B revenue | $14.2B op. inc. | 37.7% margin
Advertising:   $17.2B revenue | +22% YoY (TTM > $70B)
Retail Total:  $143.9B revenue | $9.7B op. inc. (NA+Intl)
------------------------------------------------What Makes the Thesis Different in 2026
The differentiator is the AI compute layer.
Amazon is no longer simply renting GPUs to enterprises but is competing simultaneously as a hyperscaler, a custom-silicon designer (Trainium), and a strategic anchor for one of the two leading frontier-model labs through its $8 billion investment in Anthropic.
The vertical integration thesis stands or falls on whether Amazon can convert its $364 billion AWS backlog into recurring high-margin revenue at the rate management projects.
Every other lever in the model is supportive but secondary.
Amazon Business Model Overview
Amazon operates a flywheel architecture in which one set of activities feeds the next.
Selection drives traffic, traffic drives third-party sellers, sellers drive selection, and the cost structure improves with scale, which lowers prices, which drives traffic again.
This is the original Bezos-era thesis, but it has matured into a multi-platform model.
The Five Pillars of the Business Model
The first pillar is the e-commerce marketplace, where Amazon is both a first-party retailer and a marketplace host. Third-party sellers now represent 62% of paid units sold on the platform, generating high-margin commission and fulfillment revenue.
The second pillar is the Prime membership subscription, anchoring the consumer flywheel. Subscription services produced $49.6 billion in 2025 revenue, and the membership now spans approximately 201 million U.S. customers per CIRP estimates.
The third pillar is AWS, an infrastructure-as-a-service business that sells compute, storage, networking, AI, and managed software services to enterprises, governments, and developers worldwide. AWS continues to hold the largest share of global cloud infrastructure spending at roughly 30%.
The fourth pillar is advertising, which monetizes the high-intent shopping audience, Prime Video inventory, Twitch, and Fire TV through sponsored listings, display, video, and streaming ads.
The fifth pillar is a portfolio of strategic bets, including Project Kuiper (rebranded Amazon Leo), Zoox autonomous vehicles, Ring devices, Whole Foods grocery, and Amazon Pharmacy.
REVENUE MIX BY BUSINESS LINE (FY 2025, ESTIMATES)
------------------------------------------------
Online Stores:              ~$295B
Physical Stores:             ~$22B
Third-party Seller Services: ~$170B
Subscription Services:        $49.6B
AWS:                         $128.7B
Advertising Services:         ~$68B
Other:                        ~$7B
------------------------------------------------
TOTAL FY2025 NET SALES: $716.9BGeographical Footprint
Amazon operates retail marketplaces in over 20 countries, with anchor markets in the United States, Germany, the United Kingdom, Japan, India, and an accelerating footprint in Brazil, Mexico, and the United Arab Emirates. AWS operates in 38 global regions with 120 availability zones as of late 2025.
The International segment grew 19% year-over-year to $39.8 billion in Q1 2026, with operating income of $1.4 billion.
This represents one of the more underappreciated parts of the business; International went from chronically loss-making to consistently profitable in 2024 and is now contributing positive operating leverage.
Amazon Revenue Analysis
The Q1 2026 print is the cleanest evidence yet that Amazon’s revenue mix is shifting toward higher-quality streams.
Total net sales rose 17% to $181.5 billion, beating consensus by approximately $4 billion, and the operating margin reached a record 13.1%.
Top-Line Trajectory: 2021 to Q1 2026
Amazon revenue compounded from $469.8 billion in 2021 to $716.9 billion in 2025, a 13% CAGR over four years despite the post-COVID retail digestion in 2022. The trailing twelve-month figure as of March 31, 2026 reached $742.8 billion.
REVENUE TRAJECTORY
------------------------------------------------
FY2021:     $469.8B    (+22% YoY)
FY2022:     $513.9B    (+9% YoY)
FY2023:     $574.8B    (+12% YoY)
FY2024:     $638.0B    (+11% YoY)
FY2025:     $716.9B    (+12% YoY)
Q1 2026:    $181.5B    (+17% YoY)
TTM (3/26): $742.8B    (+14% YoY)
------------------------------------------------
The Q1 2026 acceleration to 17% is meaningful because it suggests AWS-driven mix shift is more than offsetting the deceleration of mature North America retail.
Revenue Concentration and Diversification
What is most striking about the revenue base is the lack of single-customer concentration.
The largest customer in any segment is unlikely to represent more than 1% of total revenue, and the AWS customer book is similarly diffuse beyond the Anthropic agreement, which is now a meaningful but not dominant contributor.
This is an important risk-mitigation feature for investors who recall the lessons of concentrated customer bases at other software vendors.
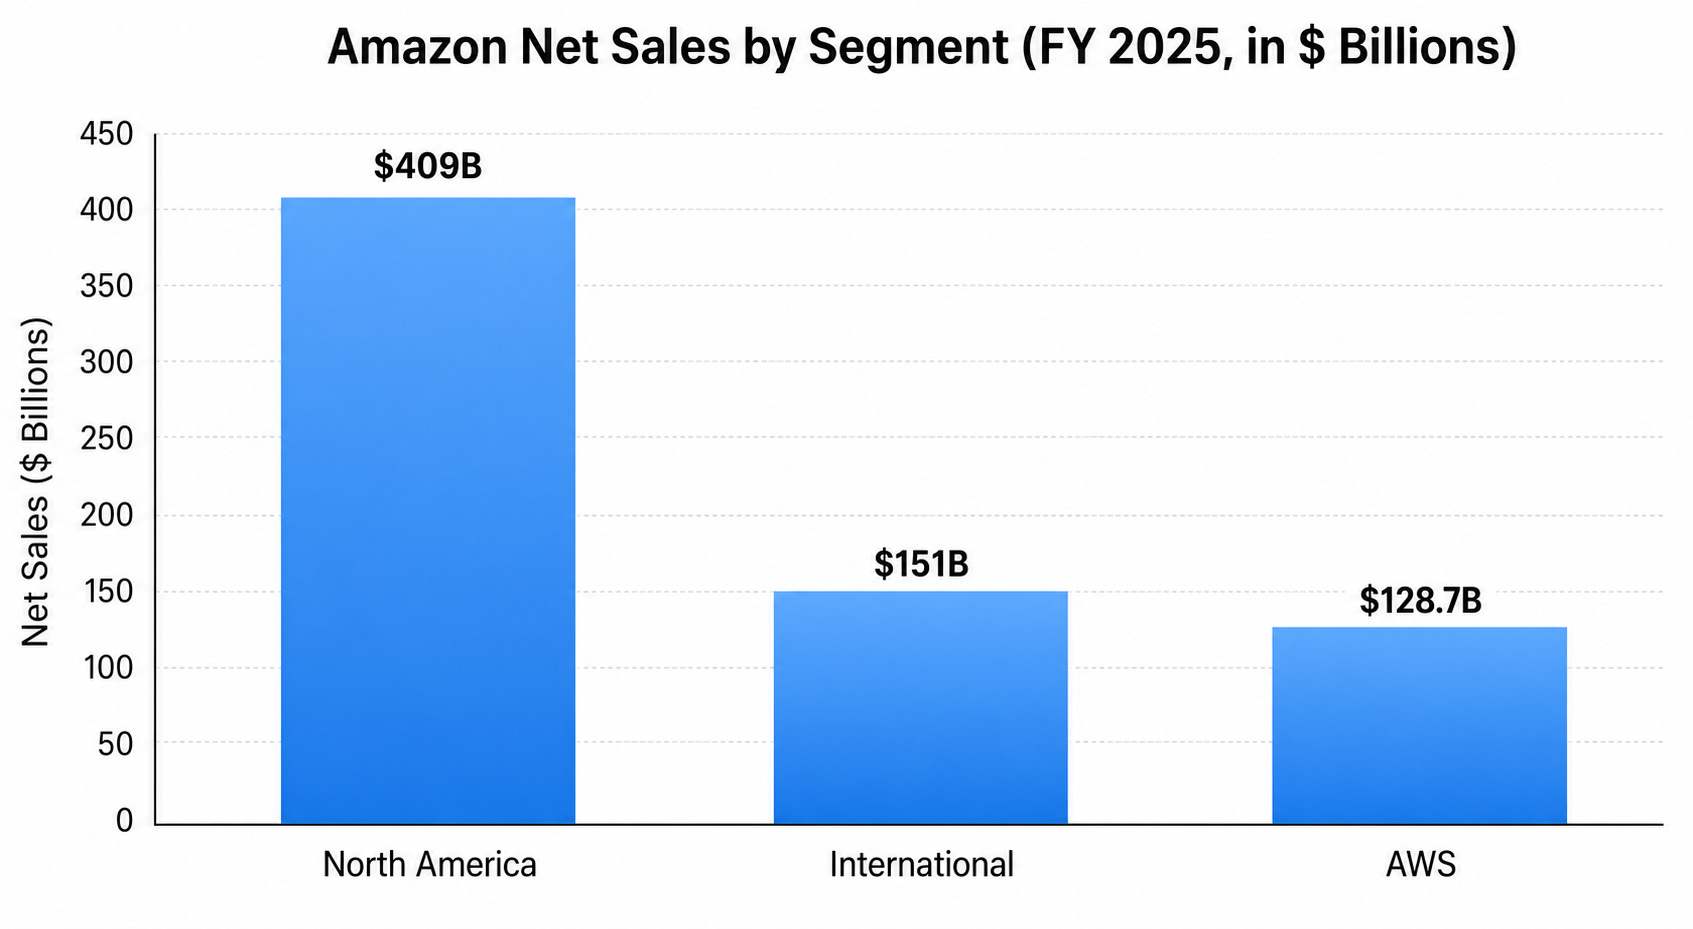
Image source: Deep Research Global analysis, based on Amazon Q4 2025 10-K filings
The Reacceleration Signal
Two data points define the 2026 reacceleration.
AWS Q1 growth of 28% versus 17% a year ago and a 15-quarter growth high, and total company growth of 17% versus 9% a year ago. International also stepped up to 19% growth in Q1 2026, an unusually strong print for that segment.
This is not the profile of a saturated business.
The combination of AWS reacceleration, sustained advertising growth, and International margin expansion is what the bull case looked like at the start of 2025 - and it is largely playing out.
Latest Quarterly Earnings: Q1 2026 Deep Dive
The April 29, 2026 earnings release was the most consequential print in two years.
The headline numbers were strong, but the market focused intensely on one thing: the raised 2026 capex guidance.
Top-Line and Bottom-Line Beat
Q1 2026 revenue of $181.5 billion exceeded the $177.3 billion consensus, and diluted EPS of $2.78 trounced the $1.64 expectation. Operating income of $23.9 billion produced a 13.1% margin, a quarterly record.
Net income of $30.3 billion was lifted partly by a non-operating gain on Amazon’s Rivian equity investment, but operating performance was strong on its own.
Segment Performance: All Three Engines Firing
North America delivered $104.1 billion in sales (up 12%) with operating income of $8.3 billion versus $5.8 billion in Q1 2025, lifting segment margin to 9.0% from 7.9% year-on-year.
International produced $39.8 billion in sales (up 19%) with $1.4 billion in operating income, demonstrating that the segment is no longer the drag it was for most of the past decade.
AWS delivered $37.6 billion in revenue (up 28%) with $14.2 billion in operating income at a 37.7% margin, well ahead of analyst expectations near 35.7%.
Q1 2026 SEGMENT RESULTS
------------------------------------------------
North America:   Sales $104.1B (+12%) | OpInc $8.3B
International:   Sales $39.8B  (+19%) | OpInc $1.4B
AWS:             Sales $37.6B  (+28%) | OpInc $14.2B
------------------------------------------------
TOTAL:           Sales $181.5B (+17%) | OpInc $23.9B
                 Op. Margin: 13.1% (record)
Q2 2026 Guidance
Management guided Q2 2026 net sales of $194.0 billion to $199.0 billion, representing 16% to 19% year-over-year growth. Operating income guidance is $16.5 billion to $21.5 billion versus $18.4 billion in Q2 2025.
The mid-point of guidance implies