
Apple (AAPL) - Fundamental Analysis Report 2026 (Updated)

Dear Readers, Welcome to Deep Research Global.
Let’s analyze the topic in detail.
Executive TL;DR
Apple (AAPL) posted record fiscal 2025 revenue of $416.16 billion and continued the momentum into FY2026, with Q1 revenue of $143.8 billion (up 16% YoY) and Q2 revenue of $111.2 billion (up 17% YoY).
Services revenue crossed $109 billion for the full fiscal 2025, with services margins of 76.5% in Q2 FY2026 driving a record blended company gross margin of 49.3%.
A historic leadership transition was announced on April 20, 2026: Tim Cook will become executive chairman effective September 1, with hardware chief John Ternus taking over as CEO.
The board authorized an additional $100 billion buyback and raised the dividend to $0.27 per share, while R&D spending climbed to a record 10.3% of revenue on AI investment.
Table of Contents
Executive TL;DR
Introduction
Apple Company Profile: Key Facts
Apple Investment Thesis
The Compounding Ecosystem
Three Pillars of Forward Growth
The Capital Return Backstop
Apple Business Model Overview
Hardware as Distribution, Services as the Annuity
Vertical Integration as a Moat
Subscriber-Centric Services Layer
Apple Revenue Analysis
FY2025 Top-Line Recap
Quarterly Revenue Acceleration into FY2026
Forward Guidance for Q3 FY2026
Apple Segment-by-Segment Teardown
iPhone: Still the Engine
Services: The Margin Engine
Mac: M-Series Refresh Cycle
iPad: Quiet Stabilization
Wearables, Home and Accessories
Earnings Quality and EPS Trajectory
Margin Mechanics
Buyback-Driven EPS Leverage
Non-Recurring Items
Cash Flow Mechanics
Operating Cash Flow Strength
Capital Expenditure Discipline
Net Cash Position
Balance Sheet Health
Liquidity and Leverage
Goodwill and Intangibles
Shareholders’ Equity Volatility
Strategic and Competitive Context
AI Strategy: Hybrid Architecture
R&D Acceleration
Competitive Landscape
China Strategy
India and Manufacturing Diversification
Latest Quarterly Earnings Guidance and Memory Cost Headwind
Q3 FY2026 Outlook
The Memory Cost Headwind
Supply Constraints
Valuation Framework
Multiple-Based Valuation Context
Bull, Base and Bear Case Scenarios
Analyst Price Target Distribution
Bull Base and Bear Case Scenario Analysis
The Bull Case: AI Supercycle Plus Services Compounding
The Base Case: Steady Compounding
The Bear Case: Margin Compression and AI Disappointment
Key Risks
Risk 1
Risk 2
Risk 3
Risk 4
Risk 5
Catalysts to Watch
Near-Term Catalysts (Next 90 Days)
Medium-Term Catalysts (90-180 Days)
Long-Term Catalysts
Apple Capital Return Program
Buyback and Dividend Mechanics
Implications for Long-Term Shareholders
My Final Thoughts
Latest Analyst Price Targets
Official Sources and Data
Disclaimer: This analysis is for informational & educational purposes only and should not be construed as investment advice. Investors should conduct their own due diligence and consult with their personal financial advisors before making investment decisions. Past performance does not guarantee future results.
Introduction
Apple Inc. closed its March 2026 quarter posting all three of its key revenue lines at record or near-record territory at the same moment its founder-successor CEO confirmed his own retirement plan.
That combination, a leadership handover layered on top of the strongest top-line momentum the company has produced in four years, is the central story for investors heading into fiscal Q3 2026.
The company also faces an unusual operating environment: a global memory shortage triggered by AI infrastructure demand, a 38% revenue surge in Greater China in the December quarter, and ongoing antitrust scrutiny of the lucrative Google search payment.
Apple Company Profile: Key Facts
Ticker:                  AAPL (NASDAQ)
Headquarters:            Cupertino, California
Founded:                 April 1, 1976
Current CEO:             Tim Cook (transitioning Sept 1, 2026)
Incoming CEO:            John Ternus
CFO:                     Kevan Parekh
Employees (FY25 10-K):   ~164,000 full-time equivalent
Fiscal Year-End:         Last Saturday of September
FY2025 Revenue:          $416.16 billion
FY2025 Net Income:       $112 billion
FY25 R&D Spending:       $34.55 billion
Active Device Base:      2.5 billion (as of Jan 2026)
Recent Close (May 19):   $298.97
Apple was founded by Steve Jobs, Steve Wozniak and Ronald Wayne in 1976, went public in December 1980, and crossed the $4 trillion market value threshold in 2026.
Its current corporate structure is organized into five reportable revenue categories (iPhone, Mac, iPad, Wearables Home & Accessories, and Services) and three reportable geographic segments built around the Americas, Europe, and Greater China, plus Japan and Rest of Asia Pacific.
The fiscal 2025 10-K reflects a company whose top line grew 6.4% year over year while its profit pool grew much faster, driven by the structural mix shift toward Services. That asymmetric growth, with profit outpacing revenue, defines the modern Apple investment thesis.
GEOGRAPHIC FOOTPRINT (FY2025)
Americas:                Largest segment
Europe:                  Second largest
Greater China:           Third largest
Japan:                   Fourth largest
Rest of Asia Pacific:    Fifth largest
The installed base figure deserves separate emphasis. On the January 29, 2026 earnings call, CEO Tim Cook confirmed that Apple’s installed base of active devices surpassed 2.5 billion, up from 2.35 billion a year earlier.
That 150 million net addition in one year is roughly the population of Russia.
Apple Investment Thesis
The Compounding Ecosystem
Apple’s investment thesis in 2026 is no longer simply about selling more iPhones. It is about the asymmetric earnings power that comes from monetizing a 2.5-billion-device installed base through high-margin, recurring Services revenue.
Each new iPhone shipped is not just a product sale; it is the activation of another lifetime customer for the App Store, iCloud, Apple Pay, Apple TV+, Apple Music, AppleCare, and the search licensing arrangement with Google.
The structural change in the gross margin profile is the cleanest evidence of this thesis playing out. Products gross margin has hovered in the high 30s for years, but blended company gross margin has been steadily climbing because the Services mix keeps growing.
In Q2 FY2026, blended gross margin hit a record 49.3%, up from 48.2% in the prior quarter and from 46.6% in the year-ago period.
APPLE GROSS MARGIN BY QUARTER
Q1 FY25: 46.9%
Q2 FY25: 46.6%
Q3 FY25: 46.5%
Q4 FY25: 47.2%
Q1 FY26: 48.2%
Q2 FY26: 49.3% (RECORD)Three Pillars of Forward Growth
The first pillar is iPhone refresh acceleration. The iPhone 17 lineup, launched in September 2025, drove iPhone revenue up 23% in Q1 FY2026 to $85.27 billion. CEO Tim Cook called this lineup “the most popular lineup in our history”.
The second pillar is Services compounding. Services delivered a 14% YoY increase in Q1 FY2026 and 16% in Q2 FY2026, hitting $30.98 billion in the March quarter. With services gross margin at 76.5%, every incremental dollar carries roughly twice the contribution profit of a product dollar.
The third pillar is AI-driven upgrade cycles. Apple Intelligence remains a multi-year story, and the partnership with Google to power Siri 2.0 unlocks a credible path to AI feature parity.

Image source: apple.com (Apple newsroom)
The Capital Return Backstop
Even if growth flattened tomorrow, the capital return program functions as a structural backstop. The board declared a dividend of $0.27 per share payable May 14, 2026, and authorized an additional $100 billion in share repurchases in the most recent quarter.
Apple spent nearly $32 billion on combined share repurchases and dividends in Q1 FY2026 alone. That pace of capital return shrinks the share count faster than most peers can grow their net income.
The investment thesis ultimately rests on this combination: a hardware-services flywheel that produces durable cash flow, paired with a buyback program that converts that cash flow directly into EPS growth.
Apple Business Model Overview
Hardware as Distribution, Services as the Annuity
Apple’s business model has quietly evolved into a two-stage monetization machine.
The first stage is hardware: the iPhone, Mac, iPad, Apple Watch, AirPods, and the Vision headset family are sold at premium prices and high product margins. The second stage is the annuity stream that sits on top of those devices.
Hardware functions as the initial customer acquisition cost, with the device price already a profit-generating transaction. Once a user is inside the walled garden, the App Store, Apple Music, iCloud, Apple TV+, Apple Pay, AppleCare and search licensing turn that user into a recurring revenue stream.
THE TWO-STAGE MONETIZATION MODEL
Stage 1 (Hardware): iPhone, Mac, iPad, Wearables
  → ~37-41% product gross margin
  → Premium pricing, refresh-cycle driven

Stage 2 (Services): App Store, iCloud, Apple Music, TV+,
  Pay, AppleCare, search licensing
  → ~75-76% services gross margin
→ Recurring, compounding baseVertical Integration as a Moat
The strategic genius of the model is vertical integration. Apple designs its own silicon (A-series and M-series chips), its own operating systems, its own services platforms, and increasingly its own first-party retail distribution. That stack-level control is a moat almost no competitor can replicate.
The M5 chip refresh introduced in the new MacBook Pro and iPad Pro in late 2025 demonstrated this strategy. By controlling silicon, Apple can extract performance and efficiency advantages that translate directly into pricing power.
The iPhone Air launch at a $999 starting price, weighing 165 grams and just 5.6 mm thick, again showed how integration enables form factors competitors cannot match.
Subscriber-Centric Services Layer
A subtle but important shift in 2025 was Apple’s accelerating push to treat itself like a media and subscriptions company. Apple TV+ posted hours-viewed up 36% in December 2025, driven by the global success of “F1” and the premiere of “Pluribus.”
Apple Pay is now live in 89 markets with more than 11,000 banks and network partners. The App Store has averaged 850 million weekly users globally, with cumulative developer payouts crossing $550 billion since 2008.
The services side has become so large that, as Constellation Research analyst Holger Mueller noted after the Q4 FY2025 earnings release, “Services are now more revenue for Apple than all non-iPhone categories together.”
Apple Revenue Analysis
FY2025 Top-Line Recap
Apple closed fiscal 2025 on September 27, 2025 with total revenue of $416.16 billion and net income of $112 billion. The Q4 quarter alone delivered $102.5 billion in revenue, an 8% YoY increase, with diluted EPS of $1.85, up 13% YoY on an adjusted basis.
For the full year, iPhone revenue was $209.59 billion and Services revenue was $109.16 billion. Mac contributed approximately $30.5 billion, iPad about $27.8 billion, and Wearables Home & Accessories around $38.9 billion.
FY2025 SEGMENT REVENUE (USD BILLIONS)
iPhone:                   $209.59
Services:                 $109.16
Wearables/Home/Acc:        $38.9
Mac:                       $30.5
iPad:                      $27.8
TOTAL FY2025:             $416.16
Quarterly Revenue Acceleration into FY2026
The fiscal 2026 ramp has been dramatic. Q1 FY2026 (December quarter) revenue surged 16% YoY to $143.76 billion, beating LSEG consensus of $138.48 billion. Q2 FY2026 (March quarter) added another $111.18 billion, up 17%, also above consensus.
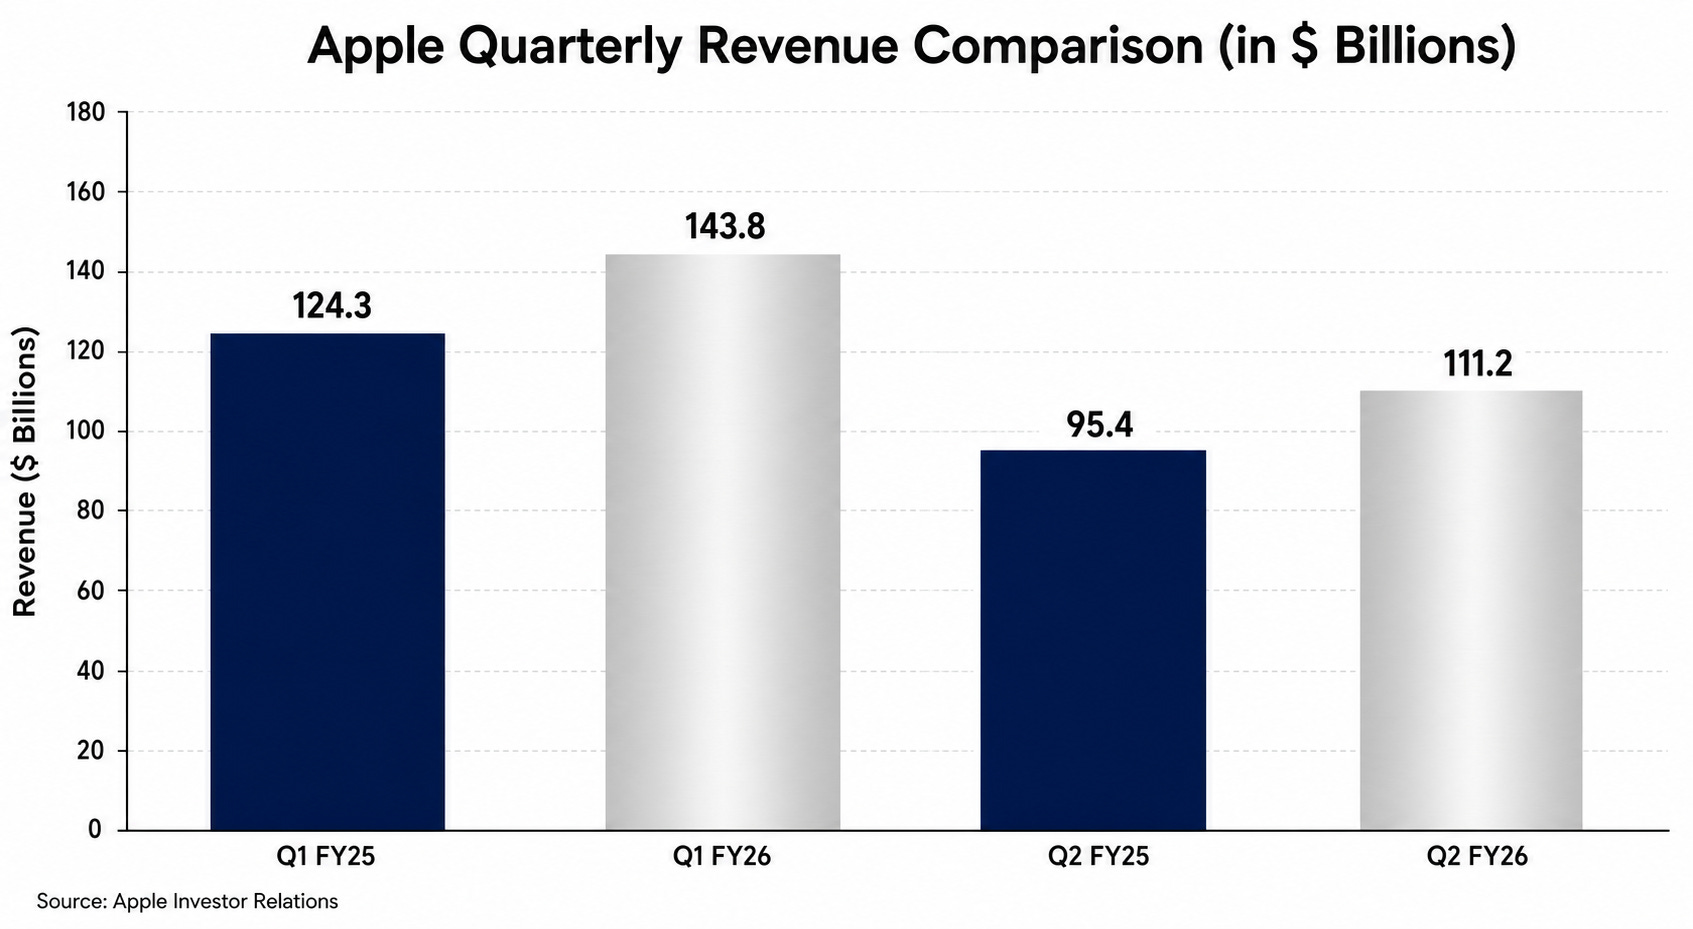
Image source: Deep Research Global analysis, based on Apple Investor Relations releases
The growth driver in Q1 FY2026 was clear: iPhone revenue of $85.27 billion, up 23%, was Apple’s best-ever single-quarter iPhone result. In Q2 FY2026, iPhone revenue was $56.99 billion, still up 22% YoY despite supply constraints.
Forward Guidance for Q3 FY2026
On the April 30, 2026 earnings call, CFO Kevan Parekh guided to 14% to 17% YoY revenue growth for the June quarter, well above the analyst consensus of 9.5%. That would translate to a Q3 FY2026 revenue range of roughly $107 billion to $110 billion.
Services growth was guided to a rate similar to the high-teens pace seen in the prior two quarters, suggesting continued double-digit expansion in the highest-margin part of the business.
FY2026 GUIDANCE ROADMAP
Q3 FY2026 Guidance: +14% to +17% YoY
Implied Revenue:    ~$107B to ~$110B
Services Growth:    Similar to recent quarters
Key Headwind:       Significant memory cost increase
Apple Segment-by-Segment Teardown
iPhone: Still the Engine
iPhone remains roughly 50-51% of consolidated revenue. The iPhone 17 lineup launched September 19, 2025, and within four months produced an all-time record iPhone quarter at $85.27 billion in the December period.
The premium positioning has held. The iPhone Air, introduced at $999, expanded the product ladder upward without cannibalizing the existing flagship Pro models, demonstrating Apple’s ability to add SKUs that pull average selling prices higher.
iPhone supply constraints in Q2 FY2026 were a meaningful headwind. Cook explicitly noted on the earnings call that revenue beat guidance “despite supply constraints” tied to advanced chip manufacturing and a global memory shortage.
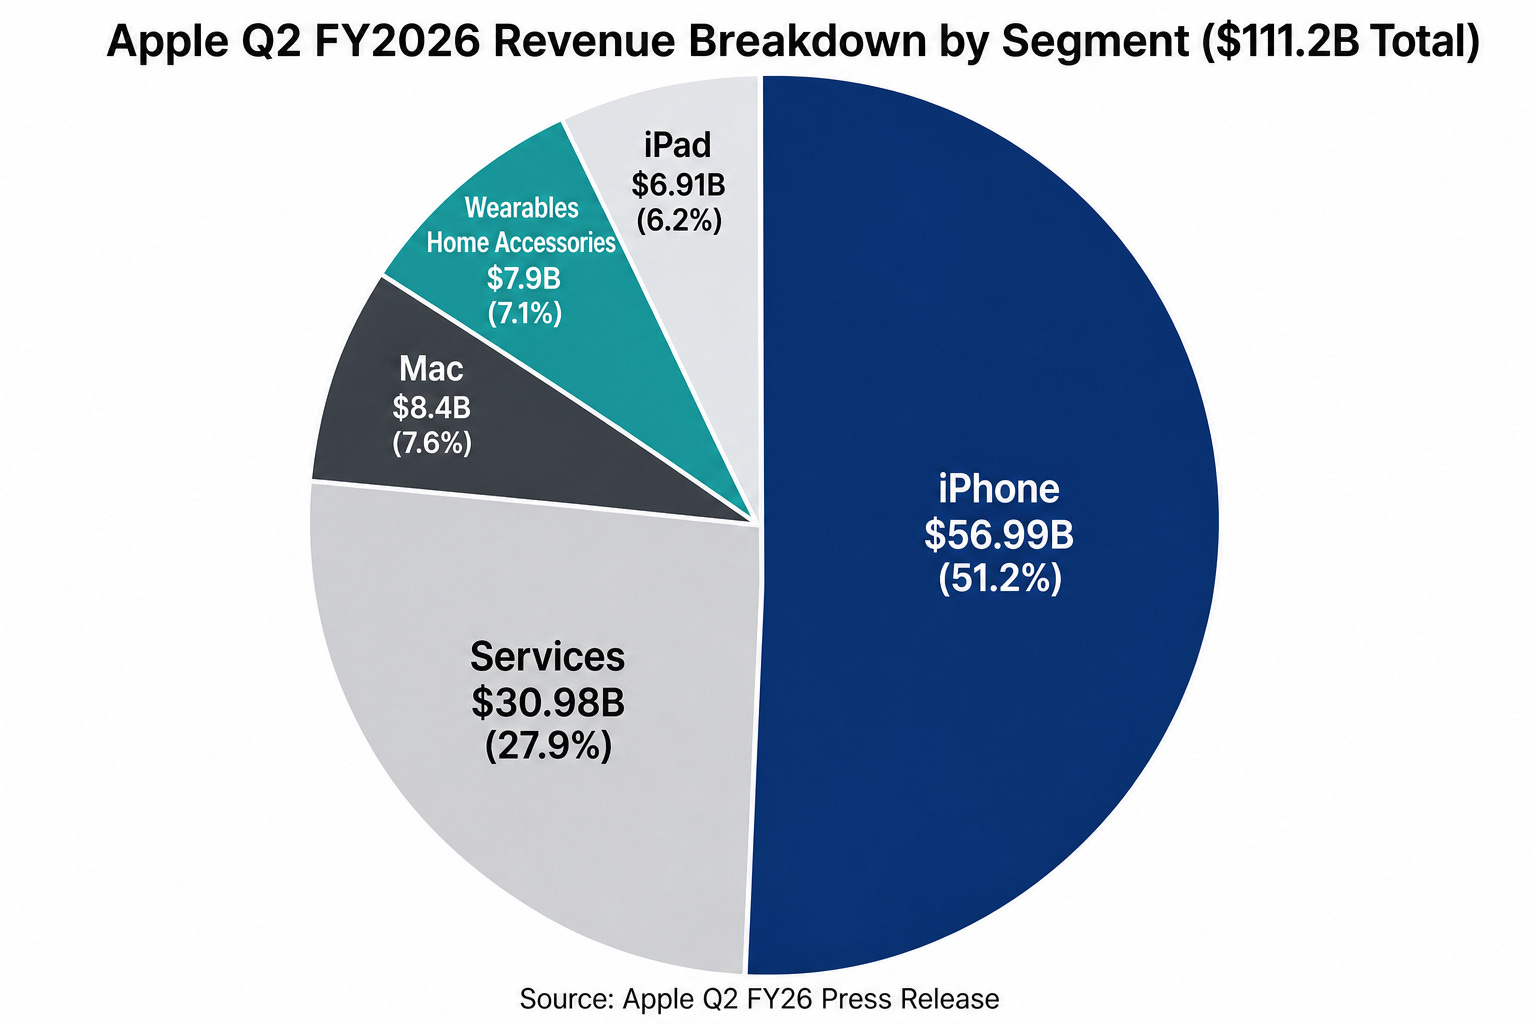
Image source: Deep Research Global analysis, based on Apple Q2 FY26 press release
Services: The Margin Engine
Services revenue grew 14% in Q1 FY2026 to $30.01 billion, then accelerated to 16% growth in Q2 FY2026, reaching $30.98 billion. Annual Services revenue crossed $109 billion in FY2025.
The most important number inside Services is the