
Meta Platforms (META) - Fundamental Analysis Report 2026 (Updated)

Dear Readers, Welcome to Deep Research Global.
Let’s analyze the topic in detail.
Executive TL;DR
Meta Platforms (META) posted a 33% revenue jump to $56.31 billion in Q1 2026, the fastest quarterly growth rate the company has logged in four years, with diluted EPS of $10.44.
The board lifted full year 2026 capex to a range of $125 billion to $145 billion, a sharp step up from the prior $115 to $135 billion plan, driven by data center buildouts and Meta Superintelligence Labs.
Reality Labs continued to bleed cash with a $4.03 billion operating loss on only $402 million of revenue, while the Family of Apps generated $26.9 billion of operating income on $55.9 billion of sales.
Daily Active People across the family of apps reached 3.56 billion in March 2026, up 4% year over year, even as the company absorbed disruptions in Iran and Russia.
Table of Contents
Executive TL;DR
Introduction
Meta Platforms Company Profile: Key Facts
The Meta Investment Thesis in 2026
Three Pillars of the Bull Case
The Bear Case Counterweight
Meta Business Model Overview
How Meta Actually Makes Money
The Two Sided Network
Reality Labs as a Separate Business
Meta Revenue Analysis: A Deep Dive
The Long Revenue Arc
What Drove the Q1 2026 Acceleration
Geographic Mix and Pricing
Latest Quarterly Earnings: A Closer Look at Q1 2026
The Headline Numbers
Operating Performance Beneath the Beat
Guidance for the Rest of 2026
Margins and Earnings Quality
Why the 40% Operating Margin Matters
Earnings Quality: The Tax Issue
Free Cash Flow and Stock Based Compensation
EPS Trajectory and Capital Returns
The EPS Ladder
Buybacks and the Dividend
Cash Flow Mechanics
Operating Cash Flow: Still a Cash Cow
Capex Is the Story
The Multi Year Capex Cliff
Balance Sheet Health
Cash Position and Liquidity
Long Term Debt
Off Balance Sheet Commitments
Segment by Segment Teardown
Family of Apps: The Money Machine
Facebook
Instagram
WhatsApp and WhatsApp Business
Threads
Reality Labs: The $90 Billion Question
Quest VR
Ray Ban Meta and Oakley Meta
Orion AR
Strategic and Competitive Context
The Generative AI Arms Race
Competition in Social and Ads
The Antitrust Overhang
Valuation Framework
Earnings Multiples
DCF Sensitivity Considerations
Comparable Company Context
Bull, Base and Bear Case Scenarios
Bull Case
Base Case
Bear Case
Key Risks Investors Should Track
Risk 1
Risk 2
Risk 3
Risk 4
META Catalysts to Watch in the Next 12 Months
Q2 2026 Earnings (Late July 2026)
Meta Connect 2026 (Fall 2026)
Llama 5 or MSL Frontier Model Release
Regulatory Decisions
Capital Return Updates
The Mark Zuckerberg Factor
Founder Control and Long Term Thinking
Talent and Organization
Industry Backdrop: Global Digital Advertising in 2026
Total Addressable Market
Ad Pricing Dynamics
Capital Allocation Philosophy
The Three Way Allocation Question
What This Means for Per Share Value
My Final Thoughts
Latest Analyst Price Targets
Official Sources and Data
Disclaimer: This analysis is for informational & educational purposes only and should not be construed as investment advice. Investors should conduct their own due diligence and consult with their personal financial advisors before making investment decisions. Past performance does not guarantee future results.
Introduction
Meta Platforms entered 2026 with a contradiction that few public companies of its size have ever attempted to balance.
The advertising machine is humming at a level it has never reached before, with quarterly revenue of $56.31 billion and operating margin still north of 40%, yet the board has simultaneously authorized one of the most aggressive capital expenditure cycles in corporate history, with up to $145 billion earmarked for AI infrastructure this year alone.
For investors, the central question is no longer whether Mark Zuckerberg can run a profitable social network.
The question is whether the cash being plowed into Meta Superintelligence Labs, Llama frontier models, GPU clusters and a slow grinding Reality Labs investment will eventually translate into returns commensurate with the risk.
This report walks through the segment economics, the competitive context, the strategic bets and the valuation framework that any serious shareholder should weigh before committing fresh capital.
Meta Platforms Company Profile: Key Facts
Meta Platforms, Inc. (NASDAQ: META) is the parent company behind Facebook, Instagram, WhatsApp, Messenger, Threads and the Reality Labs hardware portfolio that includes Quest headsets and the Ray-Ban Meta smart glasses line.
The company is headquartered at 1 Hacker Way in Menlo Park, California, and remains under the founder led control of Mark Zuckerberg through a dual class share structure.
Exchange/Ticker        : NASDAQ: META
Headquarters           : Menlo Park, California
CEO / Founder          : Mark Zuckerberg
Last Close Price       : $605.06
FY2025 Revenue         : $200.97 billion
FY2025 Net Income      : $60.46 billion
Q1 2026 Revenue        : $56.31 billion (+33% YoY)
Q1 2026 Operating Margin: ~40.6%
Family DAP (Mar 2026)  : 3.56 billion
Headcount (3/31/2026)  : 77,986
Segments : Family of Apps, Reality LabsThe corporate structure consolidates two reporting segments only: Family of Apps and Reality Labs.
Substantially all revenue today still comes from advertising sold across Facebook and Instagram, though monetization is broadening into WhatsApp Business, Threads, Click to Message ads and an early generative AI advertising stack.
The company crossed the $200 billion annual revenue threshold for the first time in 2025 with $200.97 billion in sales, a 22% increase over 2024, and posted a 41% operating margin for the full year.
The Meta Investment Thesis in 2026
Three Pillars of the Bull Case
The first pillar is the advertising flywheel.
Meta now reaches roughly half of humanity every single day, and AI driven ranking models inside Reels, Stories and Feed have pushed both impressions and pricing higher in tandem.
In Q1 2026, ad impressions delivered across the Family of Apps rose 19% year over year while average price per ad rose 12%, a combination that is rare in any mature advertising business.
The second pillar is operating leverage.
Even as headcount climbed to 77,986 and depreciation began to ramp meaningfully with new data centers coming online, Family of Apps operating margin remained extraordinary at roughly 48% in Q1 2026.
The advertising business generated $26.9 billion of segment operating income on $55.9 billion of revenue in a single quarter.
The third pillar is optionality.
Llama, AI Studio, the Meta AI assistant, WhatsApp Business Platform monetization, Threads advertising and the Ray-Ban Meta smart glasses each represent a call option on a future revenue line that is not yet fully reflected in financials.
Investors are essentially paying for the core ads business and receiving the AI and hardware optionality as a kicker.
The Bear Case Counterweight
The bear thesis starts with Reality Labs, which has now accumulated more than $90 billion in cumulative operating losses since 2020. Even Mark Zuckerberg has acknowledged this is a multi year investment with no guaranteed payoff.
Beyond Reality Labs sits the bigger question of AI capex efficiency.
The board has signed off on $125 billion to $145 billion of 2026 capital spending, most of which will land on the balance sheet as long lived assets that depreciate over six to eight years.
Even modest underutilization could meaningfully compress margins in 2027 and 2028.
The third bear leg is regulatory and competitive.
Although the company prevailed in the FTC case seeking divestiture of Instagram and WhatsApp, the FTC has filed an appeal, and TikTok, YouTube Shorts and a re emerging X all continue to compete for engagement minutes.
Meta Business Model Overview
How Meta Actually Makes Money
Despite the conversation around AI and the metaverse, Meta remains, at its core, an advertising business.
Of the $56.31 billion reported in Q1 2026 revenue, $55.0 billion came from advertising, with the remainder split across WhatsApp Business Platform fees, Meta Verified subscriptions, hardware sales and other smaller streams.
The fundamental unit of value creation is the ad auction.
Advertisers bid in real time for impressions, and Meta’s machine learning systems decide which ad to show to which user, in which surface, at which moment.
The better the targeting models, the more pricing power Meta accrues, because advertisers see higher returns on ad spend and willingly bid more.
Meta Revenue Composition (Q1 2026)
--------------------------------------
Advertising              : $55.0 billion (~97.7%)
Other FoA revenue        : ~$0.9 billion (~1.6%)
Reality Labs revenue     : $0.4 billion (~0.7%)
Total Revenue : $56.31 billionThe Two Sided Network
Meta runs a classic two sided network.
On one side sit roughly 3.56 billion daily users who consume content and generate attention. On the other side sit more than 10 million advertisers, ranging from local merchants buying $5 boosted posts on Facebook to global brands spending hundreds of millions per quarter.
The genius of the model is that each side reinforces the other. More users mean more attention to monetize, which attracts more advertisers, which funds better product investments, which attract still more users.
AI ranking has supercharged this loop because algorithmic feeds keep users engaged even when their explicit social graph engagement declines.
Reality Labs as a Separate Business
Reality Labs, the hardware and immersive computing segment, operates on entirely different economics. The division designs and sells Quest VR headsets, Ray Ban Meta smart glasses, Oakley Meta HSTN glasses and the new Ray Ban Meta Display, while also funding the long horizon research that eventually produced the Orion AR prototype.
In Q1 2026, Reality Labs generated $402 million in revenue and lost $4.03 billion. The losses reflect both R&D spending on future devices and the subsidized economics of Quest hardware. For full year 2025, the segment posted $2.21 billion of revenue against a $19.19 billion operating loss.
Meta Revenue Analysis: A Deep Dive
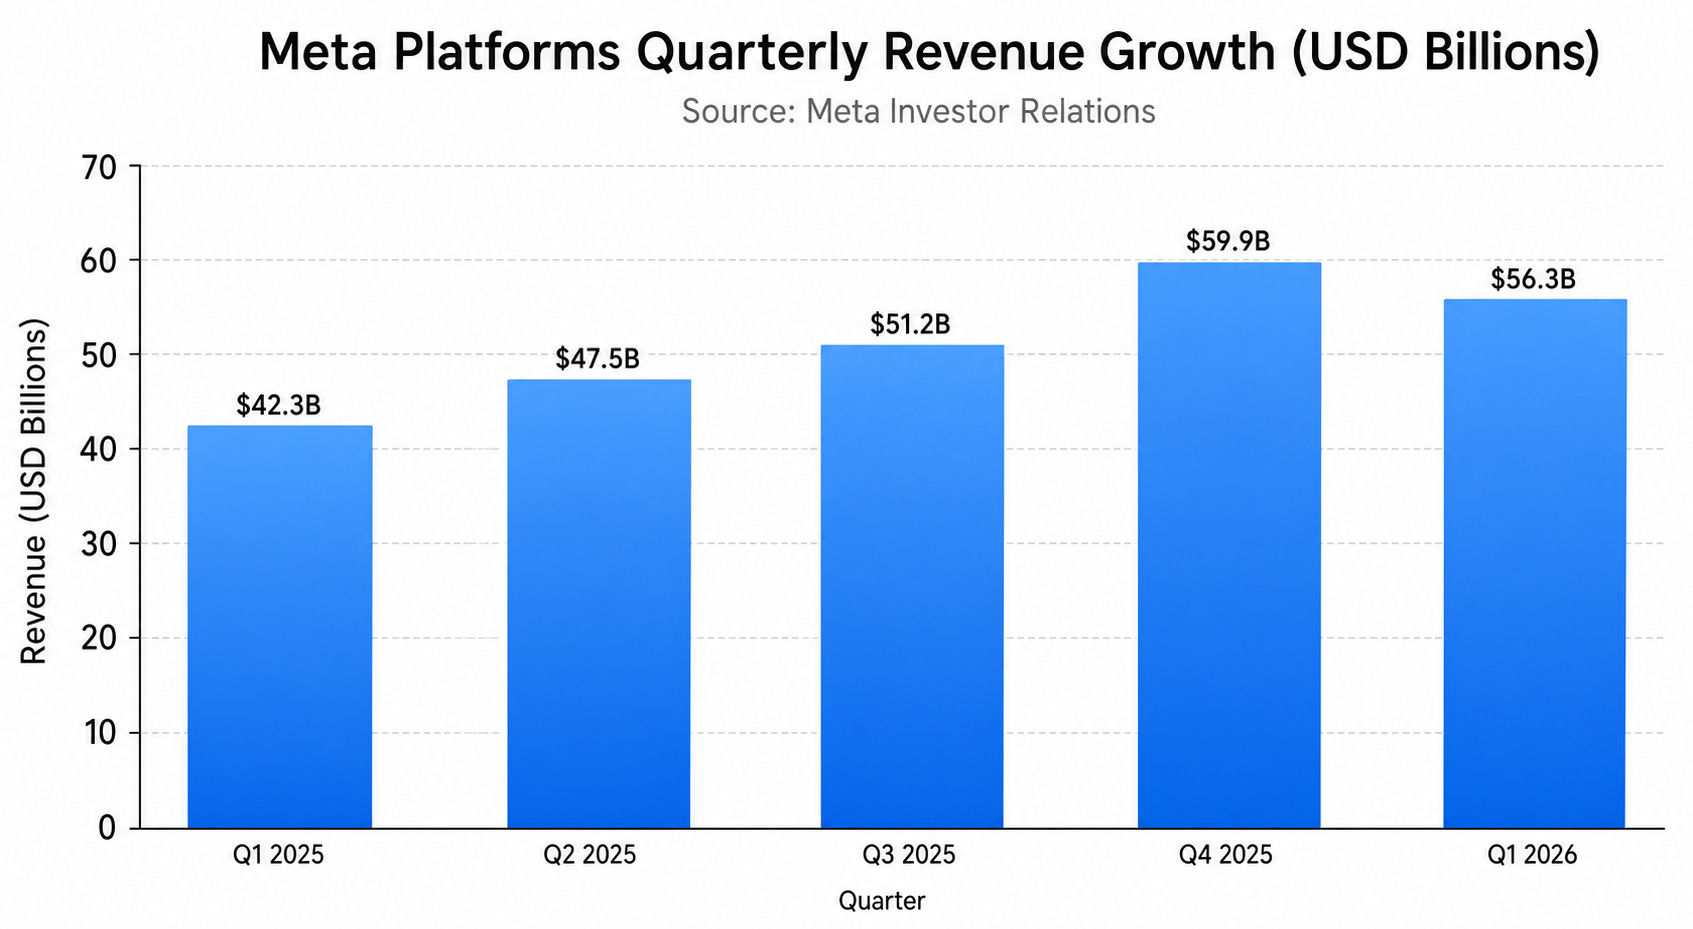
Image source: Deep Research Global analysis, based on Meta Investor Relations
The Long Revenue Arc
Meta’s annual revenue has now compounded from $117.9 billion in 2021 to $200.97 billion in 2025, a roughly 70% expansion over four years despite a brief growth dip in 2022. Q1 2026 alone delivered $56.31 billion, up from $42.31 billion in Q1 2025.
The acceleration matters because it occurred against an already enormous base.
A 33% growth rate on $42 billion is a $14 billion absolute revenue add in a single quarter, larger than the entire annual revenue of many S&P 500 companies.
What Drove the Q1 2026 Acceleration
Three forces converged.
First, AI driven ad targeting, particularly Advantage+ campaigns, materially improved advertiser ROAS.
Second, the consumption mix continued to shift toward Reels, where Meta has steadily closed the monetization gap against the rest of Feed.
Third, foreign exchange flipped from a headwind to a tailwind, with the company noting that on a constant currency basis growth would still have been 29% year over year.
Geographic Mix and Pricing
US and Canada continues to be the highest ARPU region by a wide margin, and roughly 45% of total revenue still flows from that geography.
Europe is the next largest, followed by Asia Pacific, where MAU is highest but per user monetization is the lowest of the four reporting regions.
Pricing power matters more than impression growth at this scale.
Average price per ad rose 12% year over year in Q1 2026, a remarkable signal given that competition from TikTok and YouTube Shorts has been intense for two years.
Q1 2026 Ad Engagement Metrics
-----------------------------------------
Ad impressions delivered : +19% YoY
Avg. price per ad        : +12% YoY
Implied revenue lift     : ~33% YoY
Source: Meta Q1 2026 press release
Latest Quarterly Earnings: A Closer Look at Q1 2026
The Headline Numbers
Meta reported $56.31 billion of revenue, $22.87 billion of operating income, and $26.77 billion of net income for the quarter ended March 31, 2026. Diluted EPS came in at $10.44, against a consensus estimate near $6.65.
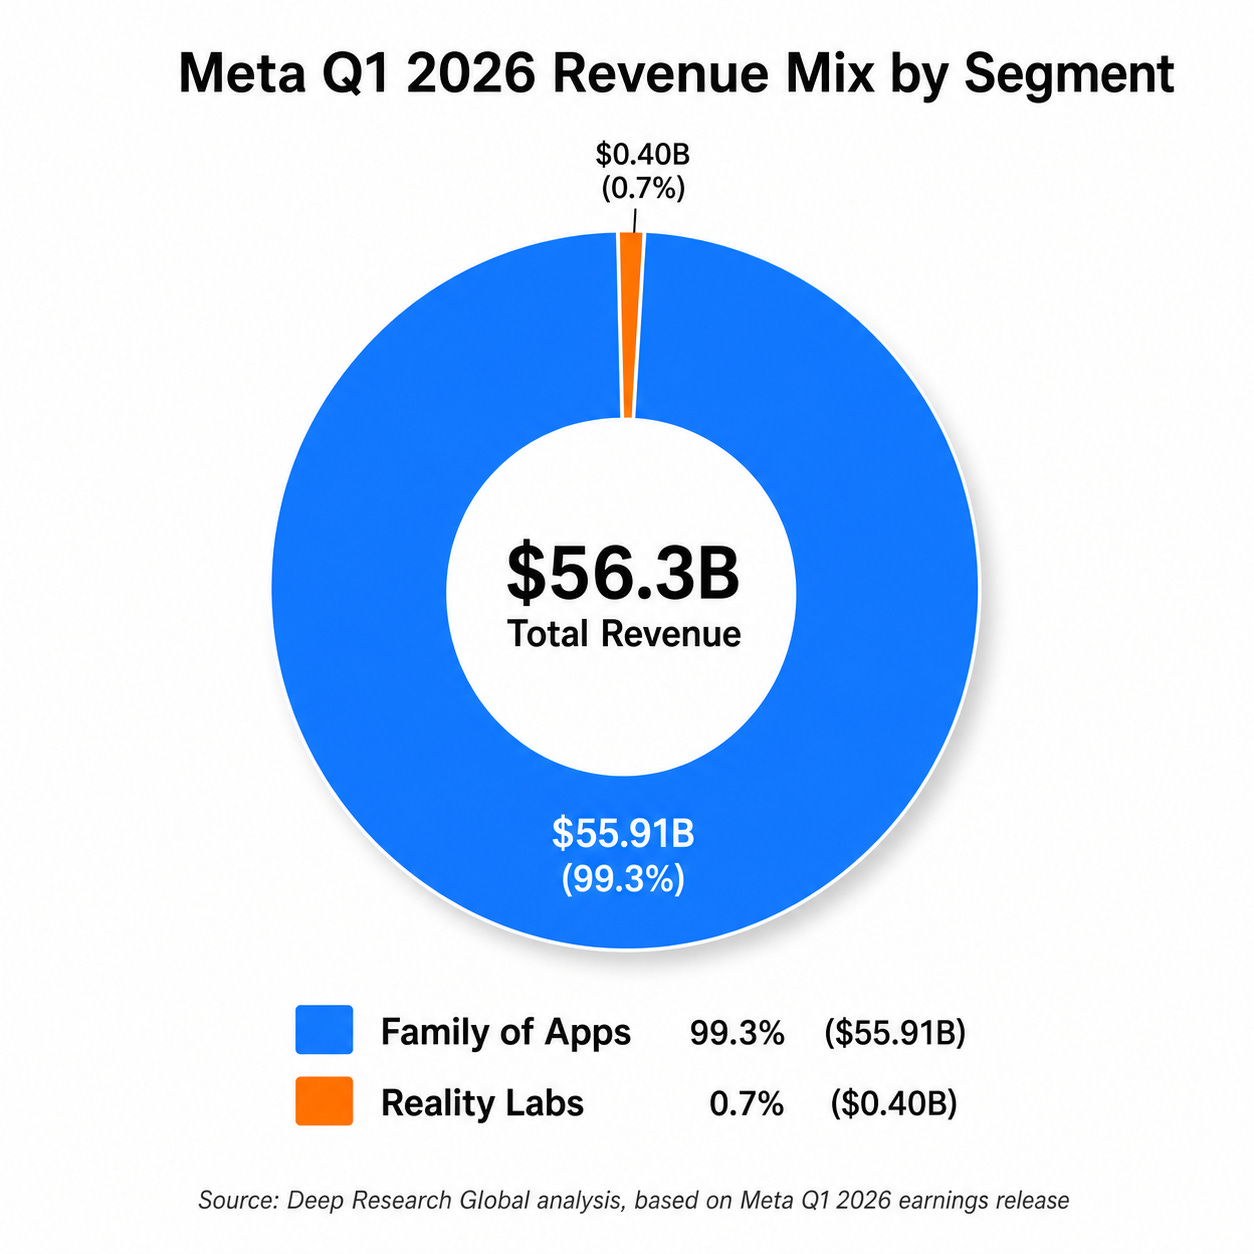
Image source: Deep Research Global analysis, based on Meta Q1 2026 earnings release
The blowout EPS number, however, was inflated by an $8.03 billion one time income tax benefit.
Excluding the benefit, the effective tax rate would have been roughly 14%, and diluted EPS would have been meaningfully lower. The reported $10.44 figure is real, but the run rate without the benefit sits closer to $7.30.
Operating Performance Beneath the Beat
The cleaner read on operating health comes from the income statement above tax.
Operating income of $22.87 billion was up from $17.56 billion in Q1 2025, an increase of roughly 30%, and operating margin landed at 40.6%. That is a slight contraction from the prior year quarter’s 41.3% margin, but well within the band the company has guided to.
The slight margin compression is the early signal of