
Walmart (WMT) - Fundamental Analysis Report 2026 (Updated)

Dear Readers, Welcome to Deep Research Global.
Let’s analyze the topic in detail.
Executive TL;DR
Walmart (WMT) closed fiscal 2026 with $713.2 billion in revenue, GAAP operating income of $29.8 billion, and consolidated net income attributable to shareholders of $21.9 billion, while delivering its eighth straight quarter of 20%+ U.S. eCommerce growth.
The business mix is shifting structurally toward higher-margin digital revenue streams: global advertising grew 37% including VIZIO, global membership fee revenue rose 15.1%, and marketplace, fulfillment services, and data monetization are scaling rapidly.
Leadership transitioned on February 1, 2026, with John Furner stepping in as President and CEO after Doug McMillon’s retirement, signaling continuity around the AI, supply chain automation, and omnichannel playbook.
Management guided FY2027 to 3.5% to 4.5% sales growth, 6% to 8% adjusted operating income growth in constant currency, adjusted EPS of $2.75 to $2.85, and the Board authorized a fresh $30 billion share repurchase program alongside the 53rd consecutive annual dividend increase.
Table of Contents
Executive TL;DR
Introduction
Walmart Inc. Company Profile: Key Facts
Walmart Investment Thesis
The Core Argument
The Three Engines That Power the Thesis
Why This Matters for the Multiple
Walmart Business Model Overview
The Omnichannel Operating System
Three Operating Segments, Three Distinct Strategies
Layered Revenue Streams
Walmart Revenue Analysis
Top-Line Performance in Fiscal 2026
eCommerce as the Growth Engine
Membership Fee Revenue
Advertising Business
Marketplace and Fulfillment Services
Latest Quarterly Earnings, Guidance, and Margins
Q4 FY26 Headline Results
FY2027 Guidance
Margin Quality and Drivers
Earnings Quality and EPS Trajectory
The Quality Question
EPS Bridge and Trajectory
Cash Flow Mechanics
The Cash Generation Engine
Capital Allocation Priorities
Balance Sheet Health
A Fortress Balance Sheet
Inventory Management
Pension and Off-Balance Sheet
Segment-by-Segment Teardown
Walmart U.S.: The Cash Engine
Walmart International: The Growth Lab
Sam’s Club U.S.: The Costco Challenger
Cross-Segment Themes
Strategic and Competitive Context
The Big Four: Walmart, Amazon, Costco, Target
Walmart vs. Amazon
Walmart vs. Costco
Walmart vs. Target
The Tech and Discounter Disruptors
Tariffs, Inflation, and the Macro Backdrop
Tariff Impact in Calendar 2025 and 2026
Inflation and Consumer Health
Automation, AI, and the Next Decade
The Supply Chain Automation Buildout
AI as a Productivity Lever
Walmart’s Partnership with Google AI
Healthcare and Pharmacy Strategy
A Refined Healthcare Approach
Valuation Framework
Where the Stock Trades
Multiple Expansion or Multiple Contraction?
Bull Base and Bear Case Scenarios
Bull Case
Base Case
Bear Case
Key Risks
Risk 1
Risk 2
Risk 3
Risk 4
Risk 5
Catalysts to Watch
Near-Term Catalysts (Next 6 Months)
Medium-Term Catalysts (6-18 Months)
Long-Term Catalysts (18+ Months)
Sustainability and ESG Considerations
My Final Thoughts
Collection of Latest Analyst Price Targets
Official Sources and Data
Disclaimer: This analysis is for informational & educational purposes only and should not be construed as investment advice. Investors should conduct their own due diligence and consult with their personal financial advisors before making investment decisions. Past performance does not guarantee future results.
Introduction
Walmart entered fiscal 2027 as the largest retailer on earth by revenue, with $713.2 billion in annual sales, 10,900-plus stores across 19 countries, and 2.1 million associates.
Yet the more interesting story for investors is not the size of the base, it’s the velocity of the mix shift inside it: roughly a quarter of fourth-quarter sales now flow through digital channels, advertising is approaching a $6.4 billion annual run rate, and a new CEO is reorganizing the company explicitly around AI and supply chain robotics.
That mix shift matters because Walmart’s terminal margin profile, free cash flow durability, and ultimately its valuation multiple are being rewritten in real time.
This in-depth report unpacks the FY26 results, the FY27 guide, the segment-by-segment economics, the competitive set against Amazon, Costco, and Target, the bull, base, and bear cases, and the catalysts and risks investors should be tracking.
Walmart Inc. Company Profile: Key Facts
Walmart Inc. is incorporated in Delaware, headquartered in Bentonville, Arkansas, and trades on the NYSE under the ticker WMT.
The company operates three reportable segments, Walmart U.S., Walmart International, and Sam’s Club U.S., and reports on a fiscal year ending January 31.
The scale is difficult to overstate. Each week, approximately 280 million customers visit a Walmart-operated location somewhere in the world. Walmart U.S. runs 4,611 stores, Walmart International operates 5,743 stores across 18 countries, and Sam’s Club U.S. operates 601 warehouse clubs.
WALMART INC. - KEY FACTS SNAPSHOT (as of FY2026 year-end, Jan 31, 2026)
Ticker / Exchange ............... WMT / NYSE
Founded ......................... 1962 (Sam Walton, Rogers, AR)
Headquarters .................... Bentonville, Arkansas, USA
FY2026 Total Revenue ............ $713.2 billion
FY2026 Operating Income ......... $29.8 billion (GAAP)
FY2026 Net Income ............... $21.9 billion
FY2026 GAAP Diluted EPS ......... $2.74
Associates Worldwide ............ ~2.1 million
Total Stores Worldwide .......... 10,900+ across 19 countries
Operating Cash Flow FY26 ........ $41.6 billion
Free Cash Flow FY26 ............. $14.9 billion
CEO (effective Feb 1, 2026) ..... John Furner
Chairman ........................ Greg Penner
The company’s mission statement remains “save people money so they can live better,”.
And its competitive moat is built on three pillars that compound on one another: scale-driven cost leadership, an omnichannel network that lets the company fulfill almost any order from a store within roughly ten miles of 90% of the U.S. population, and an expanding portfolio of higher-margin digital revenue streams layered on top of the core retail engine.
Walmart Investment Thesis
The Core Argument
Walmart is no longer just a retailer, it is becoming a hybrid retail-technology platform whose incremental dollar of revenue increasingly comes from advertising, marketplace fees, membership, and fulfillment services, all of which carry materially higher margins than selling a box of cereal or a t-shirt.
For investors, this means three things are changing simultaneously: the top line is compounding in the mid-single digits, operating income is compounding faster than sales, and the quality of earnings is improving as software-like revenue streams replace traditional retail volume.
The proof point is in the FY26 numbers. Revenue grew 5.1% to $713.2 billion, operating income grew 1.6% on a GAAP basis to $29.8 billion, and adjusted operating income grew 8.6% in constant currency. The faster-than-sales adjusted operating income growth is the structural signature of mix shift in action.
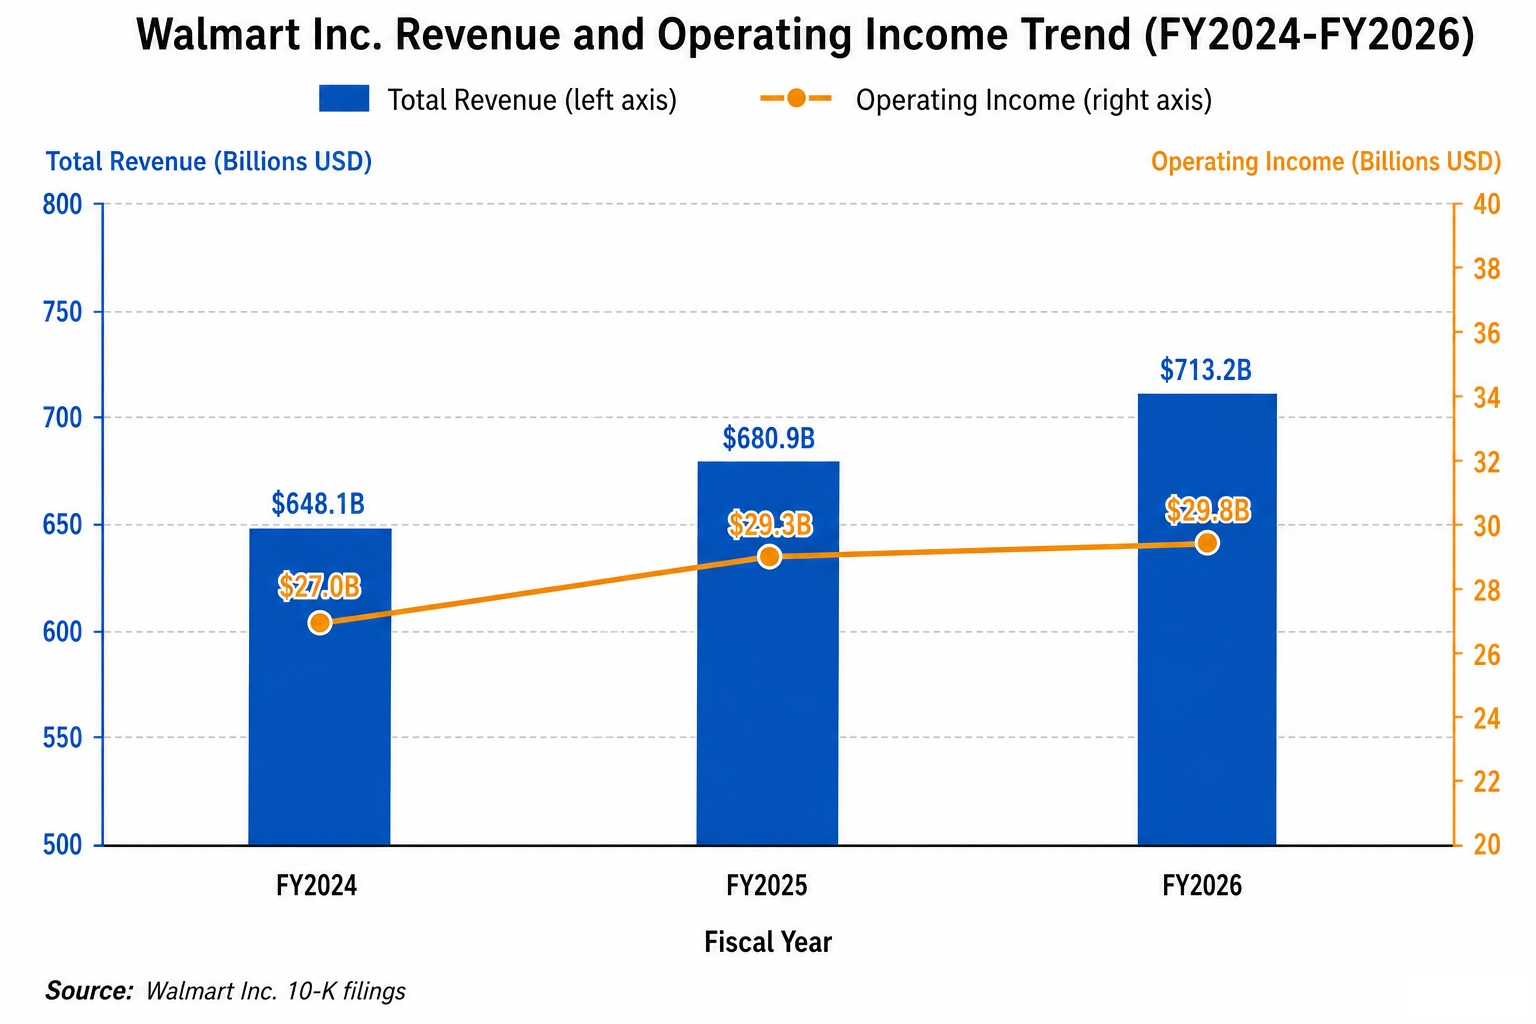
Image source: Deep Research Global analysis, based on Walmart Inc. 10-K filings
The Three Engines That Power the Thesis
The first engine is the U.S. omnichannel flywheel. Walmart U.S. comparable sales excluding fuel grew 4.6% in Q4 FY26, driven by transaction growth and unit growth rather than inflation, which is the highest-quality form of comp growth a retailer can deliver.
The second engine is the diversified income mix. Walmart Connect, the company’s first-party retail media business, grew 41% in the U.S. in Q4, and global advertising including VIZIO grew 37%, on a base that is now meaningfully large. Membership fee revenue grew 15.1% globally, with Sam’s Club China the standout contributor.
The third engine is automation-driven margin expansion. Management has stated that supply chain capital spending will likely peak over the next two years as the company finishes retrofitting its 42 regional distribution centers with Symbotic robotics, equips its high-tech automated fulfillment centers, and rolls out store-level automation.
Why This Matters for the Multiple
The Wall Street question is not whether Walmart can grow, it can, but whether it deserves a software-like valuation multiple given the structural mix shift. As of mid-May 2026, Walmart trades at roughly a 47.8x trailing P/E, versus its 10-year median around 30x. That premium is the market’s down payment on the mix-shift thesis playing out.
WHY WALMART'S MIX SHIFT MATTERS FOR INVESTORS:
1. Advertising margins typically run 70%+ vs. retail at 4-5%
2. Membership fees are near-pure profit at scale
3. Marketplace commissions are 6-20% with negligible inventory risk
4. Fulfillment services monetize existing logistics capacity
5. Data and financial services have intangible incremental cost
6. Each new dollar of "platform" revenue is worth ~10x the EPS of a retail dollar
The thesis succeeds if Walmart’s adjusted operating margin expands by 100 to 200 basis points over the next three to five years as these higher-margin streams scale, while top-line growth remains in the 3% to 5% range.
It fails if tariff pressure, wage inflation, or AI-driven price discovery from competitors compresses retail margins faster than the new businesses can scale.
Walmart Business Model Overview
The Omnichannel Operating System
Walmart’s business model is best understood as an omnichannel operating system that uses its physical store footprint as both a customer destination and a fulfillment node.
Approximately 90% of the U.S. population lives within 10 miles of a Walmart store, which means same-day delivery, curbside pickup, and store-fulfilled marketplace orders are economically viable at a scale no other retailer can match.
In the Walmart U.S. segment, store-fulfilled delivery is a particularly important wedge. In Q4 FY26, the segment delivered its eighth consecutive quarter of eCommerce growth above 20%, with much of that volume serviced by associates picking from store shelves and delivered by Spark drivers, the company’s gig-economy delivery network.
That economic structure matters because it converts the fixed cost of a 200,000-square-foot store into the marginal cost of a fulfillment center, without requiring incremental capex. Each new delivery order shares the same store rent, lighting, refrigeration, and headcount.

Image source: Walmart Corporate, Retail Renaissance announcement
Three Operating Segments, Three Distinct Strategies
The Walmart U.S. segment generated $483.0 billion in net sales in FY26, representing 68% of consolidated net sales, and is the cash engine that funds investment everywhere else. It is also the most mature segment, where comparable transaction growth and a mix shift toward digital are the primary drivers.
Walmart International generated $130.4 billion in net sales (19% of the consolidated total) and is the company’s growth and innovation lab. The segment is concentrated around three high-quality national champions: Walmex (Mexico and Central America), Flipkart and PhonePe (India), and Walmart China including Sam’s Club China.
Sam’s Club U.S. generated $93.0 billion in net sales (13% of the consolidated total) and is the membership-driven warehouse business that competes directly with Costco. Sam’s Club U.S. comparable sales excluding fuel grew 4.0% in Q4 FY26, and membership reached record highs during the quarter.
Layered Revenue Streams
On top of the three core segments, Walmart layers a portfolio of cross-segment revenue streams that have become structurally important.
WALMART'S LAYERED REVENUE ARCHITECTURE
-------------------------------------------------
LAYER 1: CORE RETAIL (Net Sales)
  Walmart U.S. ........... $483.0B
  Walmart International .. $130.4B
  Sam's Club U.S. ........ $93.0B

LAYER 2: MEMBERSHIP & SUBSCRIPTION
  Sam's Club fees, Walmart+ fees
  Q4 FY26 global growth: +15.1%

LAYER 3: ADVERTISING (Walmart Connect + VIZIO)
  Global annual run rate: ~$6.4B
  Q4 FY26 global growth: +37%

LAYER 4: MARKETPLACE & FULFILLMENT
  3P seller commissions + WFS fees
  ~150,000+ active sellers

LAYER 5: DATA & FINANCIAL SERVICES
  Walmart Luminate, OnePay, Goldman partnership
-------------------------------------------------
The economic significance of Layers 2 through 5 is that they grow at multiples of overall sales growth, carry margin profiles between 50% and 90%, and require relatively little incremental capital. They are the levers that allow operating income to grow faster than sales over time.
Walmart Revenue Analysis
Top-Line Performance in Fiscal 2026
Walmart reported total revenues of $713.2 billion for fiscal 2026, up from $680.9 billion in fiscal 2025, representing roughly 4.7% reported growth and 5.1% constant-currency growth.
The fourth quarter alone produced $190.7 billion in revenue, up 4.9% on a constant currency basis and 5.6% as reported.
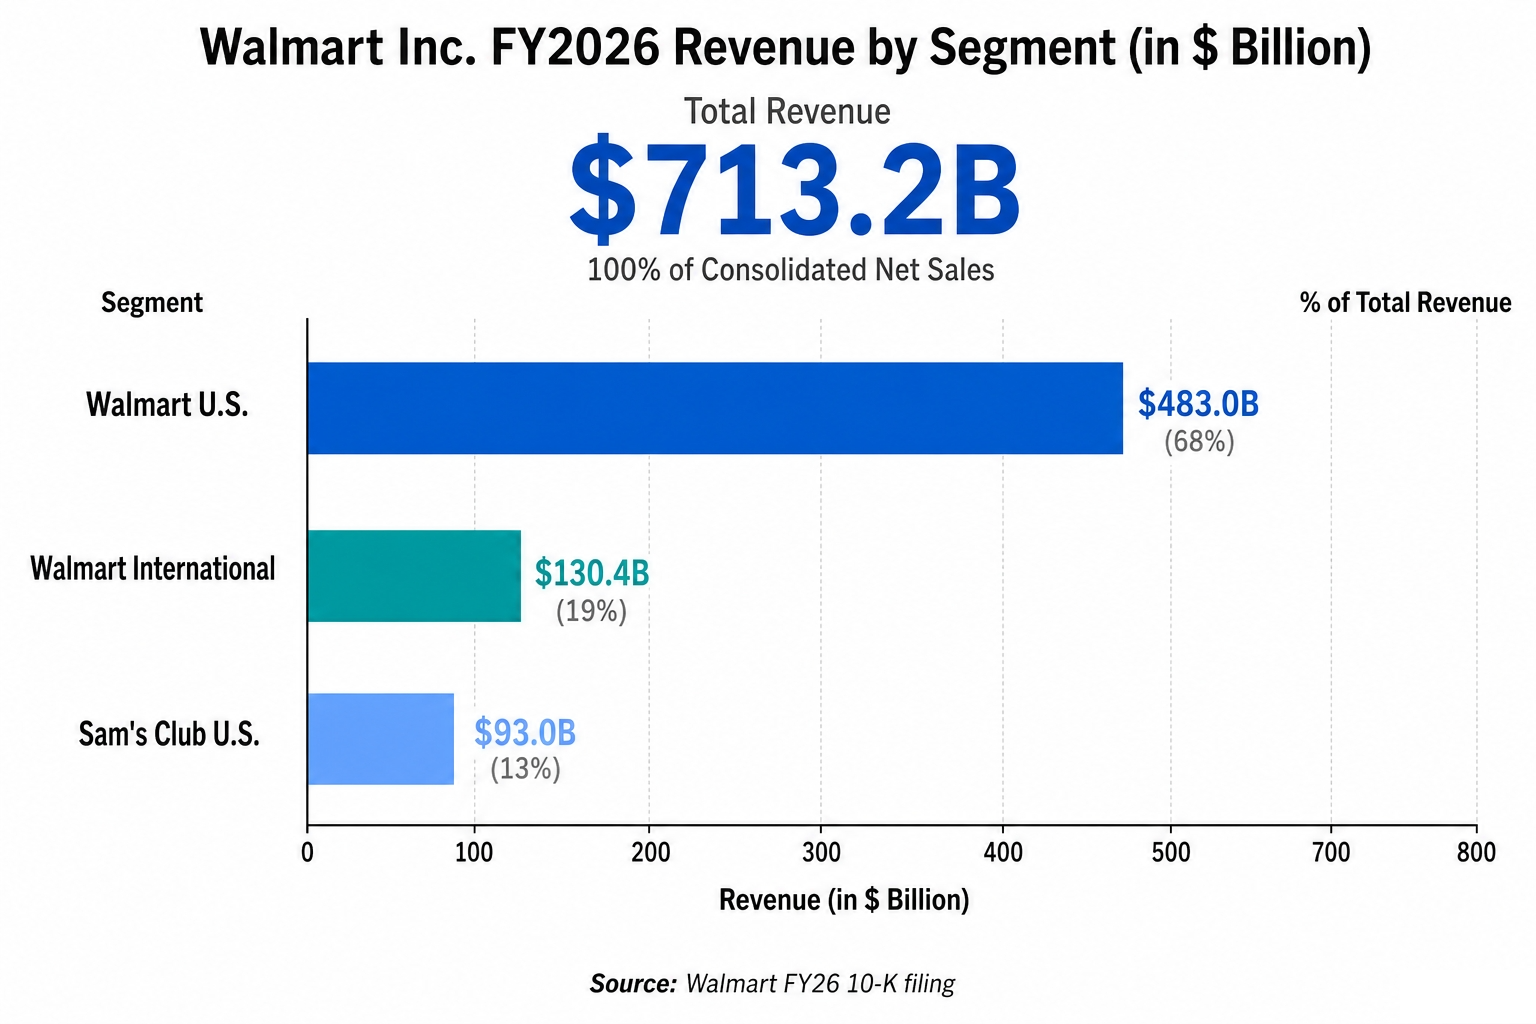
Image source: Deep Research Global analysis, based on Walmart FY26 10-K filing
The composition of growth is what matters for investors.
Strong demand for fast delivery drove eCommerce, while a healthier general merchandise environment helped Walmart U.S. transactions and unit growth.
Importantly, management has noted across multiple calls that growth has been driven by