
Micron Technology (MU) - Fundamental Analysis Report 2026 (Updated)

Dear Readers, Welcome to Deep Research Global.
Let’s analyze the topic in detail.
Executive TL;DR
Micron (MU) just printed the most dramatic quarter in the company’s 48-year history, with fiscal Q2 2026 revenue of $23.86 billion, up 196% year-over-year, and non-GAAP gross margin of 74.4%.
The company briefly crossed $1 trillion market cap on May 26, 2026, joining Samsung and SK Hynix in the trillion-dollar memory club after an eightfold share gain over twelve months.
High Bandwidth Memory is the engine: Micron’s HBM share jumped from 9% in Q4 2024 to 21% in Q4 2025, and the entire 2026 HBM book is sold out under multi-year contracts that increasingly include prepayments.
Capex is being scaled to over $25 billion in fiscal 2026 as the company builds out Idaho, Tongluo (Taiwan), New York, Japan, Singapore, and India to address what management calls a multi-year structural shortage.
Recommended - Read Full Reports


Read All Reports
Table of Contents
Executive TL;DR
Introduction
Micron Technology Company Profile: Key Facts Snapshot
Micron Investment Thesis: Why the AI Era Has Reshaped Memory
The Core Argument
The Demand Signal
The Supply Signal
The Margin Signal
Micron Business Model Overview
Two Core Technologies, Four Business Units
How the Money Flows
Manufacturing Footprint: A Truly Global Memory Supply Chain
Micron Revenue Analysis
From $25.1B in FY2024 to $37.4B in FY2025 to Running at $33B+ Per Quarter
Pricing Power, Not Just Volume
Segment Revenue Breakdown for Q2 FY26
Margins, Earnings Quality, and EPS Trajectory
The Operating Income Engine
EPS Trajectory: From Losses to Record Earnings in Eight Quarters
Earnings Quality: The Cash Backs It Up
Cash Flow Mechanics and Balance Sheet Health
Cash Position
Debt Profile
Capital Returns
Micron Segment-by-Segment Teardown
Cloud Memory Business Unit (CMBU)
Core Data Center Business Unit (CDBU)
Mobile and Client Business Unit (MCBU)
Automotive and Embedded Business Unit (AEBU)
Major Micron Competitors
Micron vs. SK Hynix: The HBM Heavyweight Bout
Micron vs. Samsung Electronics: The Tortoise Trying to Catch Up
Micron vs. Kioxia and SanDisk: The NAND Battleground
Micron vs. Chinese Competitors: CXMT and YMTC
Micron Strategic Context: Why Now Is Different
The HBM Architecture Has Changed the Memory Equation
The 1-Gamma Node and EUV: Micron’s Manufacturing Bet
HBM4 and HBM4E: The Forward Roadmap
SOCAMM2 and Modular Memory: A New Form Factor
Micron Valuation Framework
The Cyclical Memory Lens
The Structural AI Memory Lens
The Sum-of-Parts Lens
Bull, Base, and Bear Case Scenario Analysis
Bull Case
Base Case
Bear Case
Key Risks for Micron Technology
Risk 1
Risk 2
Risk 3
Risk 4
Risk 5
Risk 6
Risk 7
Catalysts to Watch in 2026 and 2027
My Final Thoughts
Latest Analyst Price Targets
Official Sources and Data
Disclaimer: This analysis is for informational & educational purposes only and should not be construed as investment advice. Investors should conduct their own due diligence and consult with their personal financial advisors before making investment decisions. Past performance does not guarantee future results.
Introduction
Memory used to be the unloved corner of semiconductors. Cyclical, commoditized, prone to violent price swings tied to PC and smartphone cycles.
That history has been rewritten in real time over the last 18 months, and the company at the center of the rewrite is Boise-based Micron Technology.
In fiscal Q2 2026 alone, Micron generated more revenue than it did in any full year before fiscal 2018.
The question for investors right now is not whether the supercycle is real, but whether the structural shifts in memory architecture, customer contracts, and AI compute design have permanently altered the cyclical profile of this business or merely created the most extreme up-leg the industry has ever seen.
This report walks through Micron’s business segments, segment-by-segment economics, the HBM competitive landscape against SK Hynix and Samsung, the CHIPS Act-funded US manufacturing footprint, the $200 billion domestic investment commitment, and the risk factors that could derail the thesis.
By the end, you should have a clear picture of where the cash is being generated, where it is being deployed, and what could go right or wrong.
Micron Technology Company Profile: Key Facts Snapshot
Micron Technology was founded in October 1978 by four engineers in the basement of a Boise, Idaho, dental office.
By 1980 it had broken ground on its first wafer fabrication facility, and from that single Idaho fab it grew into one of only three companies in the world capable of producing leading-edge DRAM at scale.
The company is headquartered at 8000 South Federal Way, Boise, Idaho, and trades on the Nasdaq under the ticker MU.
Its fiscal year ends in late August or early September. Sanjay Mehrotra has served as Chairman, President, and Chief Executive Officer since 2017, after co-founding SanDisk in 1988 and leading that company through its sale to Western Digital.
Quick Facts: Micron Technology, Inc.
Headquarters    : Boise, Idaho, USA
Founded         : October 1978
Ticker          : MU (NASDAQ)
CEO/Chairman    : Sanjay Mehrotra
Fiscal Year End : Late August / early September
Employees       : ~48,000 globally (FY2025 10-K)
Core Products   : DRAM, NAND flash, HBM, SSDs, managed NAND
Customers       : Hyperscalers, OEMs, automotive, industrial
The company’s product portfolio is built around two memory technologies: DRAM, which provides fast, volatile working memory, and NAND, which provides non-volatile storage.
Within DRAM, Micron now competes in five primary product families:
Standard server DRAM (DDR5),
Low-power DRAM (LPDDR5X),
Graphics DRAM (GDDR7),
High Bandwidth Memory (HBM3E and HBM4), and
Emerging modular formats such as SOCAMM2 designed specifically for AI servers.
Micron is one of only three pure-play producers of leading-edge HBM globally, alongside South Korea’s SK Hynix and Samsung Electronics.
That oligopoly structure is a critical underpinning of the investment thesis.
Micron Investment Thesis: Why the AI Era Has Reshaped Memory
The Core Argument: Memory Has Moved From Component to Strategic Asset
For three decades, memory was a margin-thin, supply-driven business with deeply cyclical earnings. The technology was largely fungible, customers had multiple second sources, and pricing followed the wafer-supply curve almost mechanically.
The AI compute architecture has broken this model.
Each Nvidia Blackwell GPU consumes roughly 3.5 times the HBM content of the prior generation, and the upcoming Vera Rubin platform pushes that ratio higher still.
HBM requires approximately three times the wafer capacity of standard DRAM, which means every gigabyte of HBM produced removes roughly three gigabytes of standard DRAM supply from the broader market.
This creates a structural undersupply across all memory categories, not just the HBM that AI accelerators demand.
The market is now pricing memory the way it once priced rare earth elements: strategically, with multi-year contracts, prepayments, and customer prioritization decisions.
The Demand Signal: Data Center Now Above 50% of Industry TAM
Management explicitly stated that calendar 2026 will be the first year in history where data center DRAM and NAND bit total addressable market crosses 50% of industry-wide TAM.
That figure is staggering when you consider that data center represented roughly 35% of Micron’s own revenue mix as recently as fiscal 2024.
For Micron specifically, data center revenue (combining Cloud Memory Business Unit and Core Data Center Business Unit) hit 56% of FY2025 revenue, up from 35% in FY2024.
In dollar terms, data center revenue jumped 137% year-over-year to $20.75 billion in FY2025.
Snapshot: Data Center as % of Micron Revenue
FY2024 : ~35%
FY2025 : ~56%
Q2 FY26: ~57% (Cloud + Core Data Center combined)The Supply Signal: HBM Sold Out, Contracts Multi-Year
Micron has stated repeatedly that its entire calendar 2026 HBM allocation is committed under long-term contracts, and management has begun discussing what it calls “longer-horizon customer contracting structures.”
In April 2026, the company signaled it had signed its first five-year HBM supply agreement covering both volume and pricing.
That single contractual development is, in my view, the most important fundamental change in the memory industry’s recent history. It transforms HBM revenue from a price-volatile cycle product into something closer to a contracted, capacity-constrained service business with embedded prepayments.
The Margin Signal: Non-GAAP Gross Margin Reached 74.4% in Q2 FY26
The leverage in the model is brutal in the best possible way.
Q2 FY2026 non-GAAP gross margin hit 74.4%, up from 51.3% in Q1 FY2026 and roughly 38% in Q2 FY2025.
Management guided Q3 FY2026 gross margin to approximately 81%.
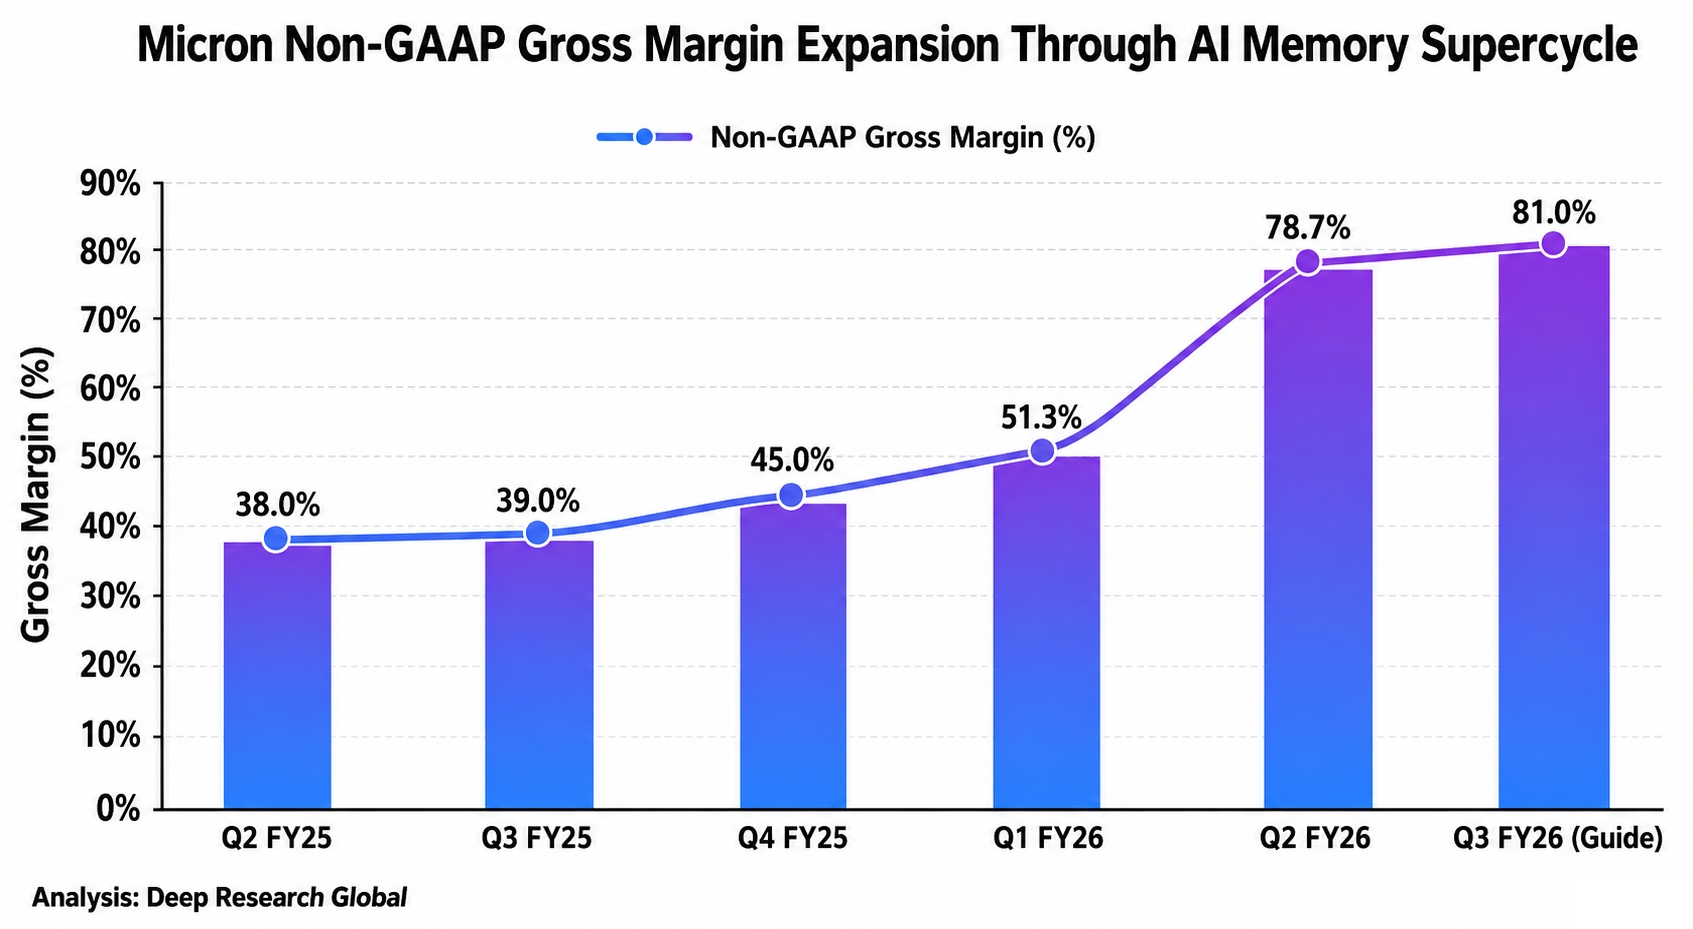
Image source: Deep Research Global analysis. Non-GAAP gross margin trajectory showing the expansion from Q2 FY25 through Q3 FY26 guidance, reflecting the structural pricing power created by the AI-driven memory shortage.
This is a pure memory company. Generating gross margins that would make a premium software vendor pause.
The combination of mix shift toward HBM (which carries materially higher margins), tight industry supply, and multi-year contracted pricing has decoupled Micron’s margin profile from the historical commoditized memory pattern.
Micron Business Model Overview
Two Core Technologies, Four Business Units
Micron’s product set splits into DRAM and NAND, but the company reports financials by four end-market-aligned business units.
This structure was reorganized in fiscal 2025 to better reflect how the business actually serves customers.
The four business units are:
Cloud Memory Business Unit (CMBU),
Core Data Center Business Unit (CDBU),
Mobile and Client Business Unit (MCBU), and
Automotive and Embedded Business Unit (AEBU).
Each unit aggregates DRAM and NAND products targeted at a specific end market, which means HBM revenue (sold primarily to hyperscalers and AI accelerator vendors) flows mostly through CMBU.
Micron Business Unit Structure (FY2026)
CMBU : Cloud Memory      - HBM, high-cap DDR5, LP server DRAM
CDBU : Core Data Center  - Enterprise DRAM, enterprise SSDs
MCBU : Mobile and Client - LPDDR5X, smartphone NAND, PC DRAM
AEBU : Automotive and Embedded - Auto-grade DRAM/NAND, industrialHow the Money Flows
Micron sells primarily through three channels.
First, direct sales to large hyperscalers and AI infrastructure builders, which include the major cloud companies and Nvidia for HBM.
Second, sales to original equipment manufacturers building servers, PCs, smartphones, and automotive systems.
Third, distribution channels for industrial and embedded customers.
The customer concentration risk is real and discussed in detail later in this report.
A handful of hyperscalers and Nvidia represent the dominant share of HBM bookings, and the top ten customers collectively account for a substantial majority of total revenue per the company’s 10-K disclosures.
Manufacturing Footprint: A Truly Global Memory Supply Chain
Micron operates wafer fabs and assembly/test facilities across the United States, Taiwan, Japan, Singapore, China, and India.
The company’s most advanced DRAM production occurs in Taiwan (Taichung and Tongluo), Japan (Hiroshima), and increasingly in Idaho as the new Boise fab ramps. NAND production is concentrated in Singapore and Japan.
The company is in the midst of executing a $200 billion US investment plan, of which $150 billion targets manufacturing capacity and $50 billion targets R&D.
The plan includes two fabs in Boise, four fabs in Clay, New York (the largest planned chip facility in the United States), and expansion of the Manassas, Virginia facility.
Micron US Manufacturing Roadmap (post-2025 expansion)
Boise, Idaho     : ID1 (DRAM, ramping FY27) + ID2 (HBM packaging, new)
Clay, New York   : 4-fab campus (largest US chip fab planned)
Manassas, VA     : Expansion for legacy and specialty memory
CHIPS funding    : $6.2B (NY/ID) + $275M (VA)
Job creation : ~90,000 direct and indirectMicron Revenue Analysis
From $25.1B in FY2024 to $37.4B in FY2025 to Running at $33B+ Per Quarter
The growth curve is so steep that even putting the numbers next to each other strains plausibility for anyone who has covered the memory industry for any length of time.
Fiscal 2024 (ended August 2024) revenue was $25.1 billion. Fiscal 2025 (ended August 28, 2025) revenue was $37.38 billion, up 49% year-over-year.
Then fiscal Q1 2026 (ended November 27, 2025) printed $13.64 billion, Q2 FY2026 (ended late February 2026) printed $23.86 billion, and management guided Q3 FY2026 (ending late May 2026) to approximately $33.5 billion.
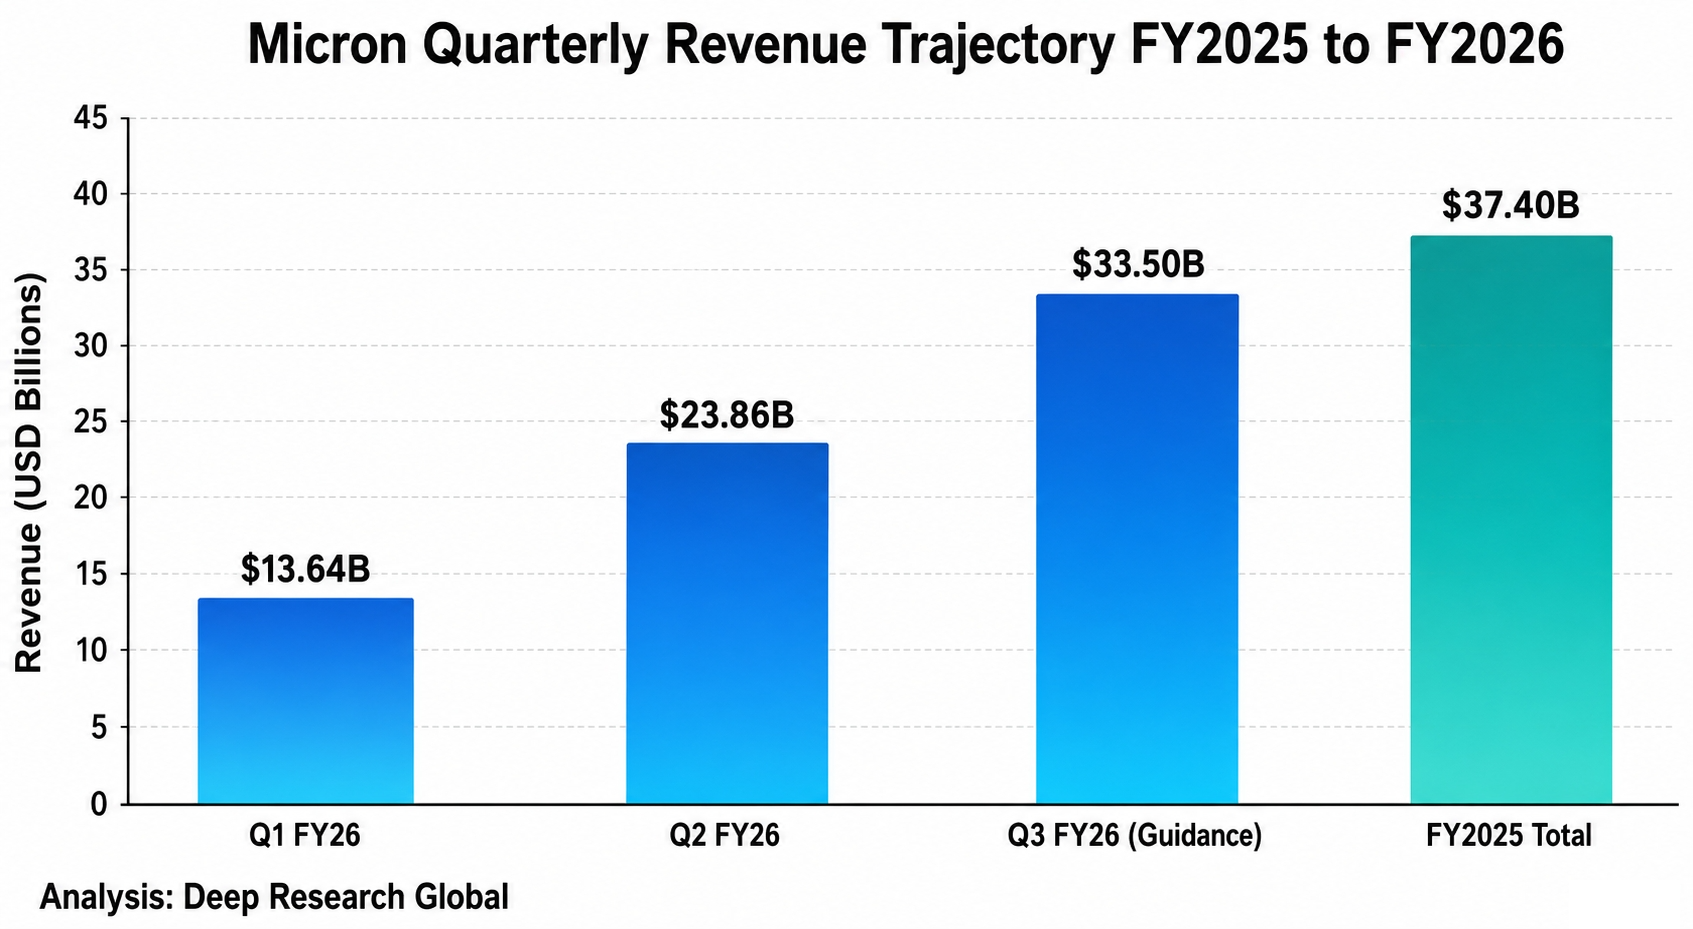
Image source: Deep Research Global analysis. Sequential revenue acceleration across the most recent four quarterly data points, showing how Micron has more than doubled quarterly revenue in roughly six months.
If you annualize the Q3 FY2026 guidance, you arrive at a $134 billion annualized revenue run rate.
To put that in perspective, that’s roughly four times what Micron generated in fiscal 2024 just two years prior.
Pricing Power, Not Just Volume
A reasonable initial reaction is to assume this growth is driven primarily by bit volume increases. It’s not.
The dominant driver is per-bit pricing, with secondary contributions from product mix (more HBM, less commodity DRAM) and content growth per device.
DRAM and NAND average selling prices have risen consistently quarter over quarter through fiscal 2026, and the company’s commentary on its Q2 FY26 earnings call emphasized that price increases reflected genuine supply-demand imbalance rather than spot market speculation.
The proof, in my view, is that hyperscalers are now signing multi-year contracts that lock in pricing, which they would not do if they believed prices were spiking transiently.
Segment Revenue Breakdown for Q2 FY26
The segment mix in Q2 FY2026 tells a clear story about where the growth is concentrated.
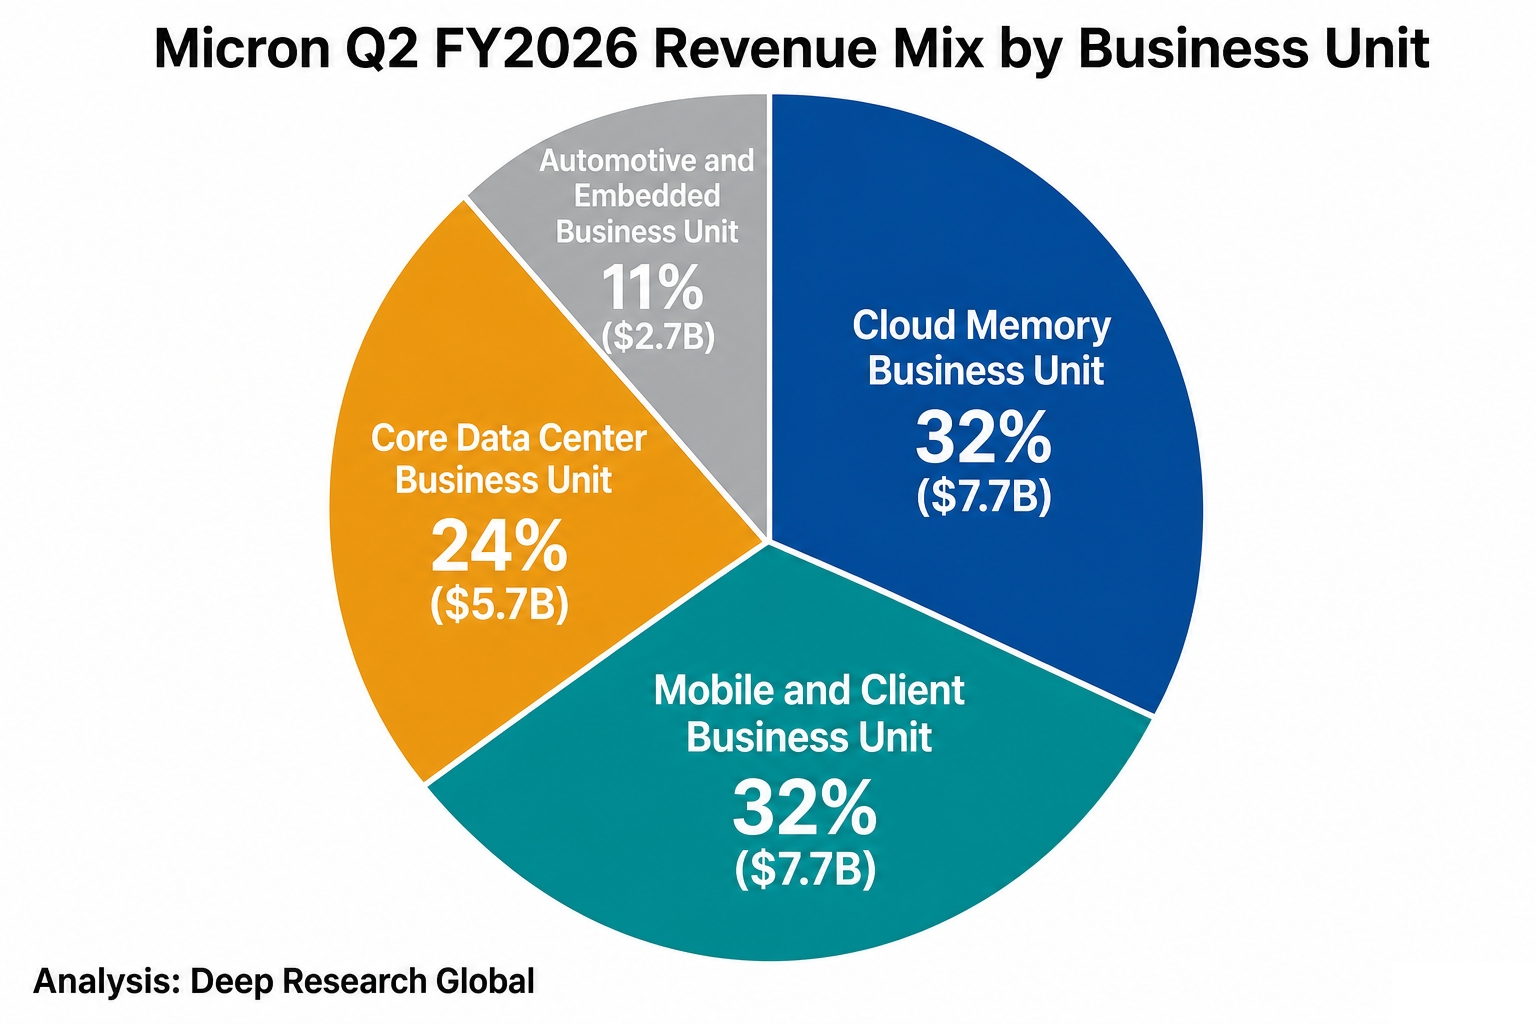
Image source: Deep Research Global analysis. Q2 FY2026 revenue distribution across Micron’s four reporting business units, with data center (Cloud + Core) collectively making up 57% of company revenue.
Cloud Memory Business Unit delivered $7.7 billion (32% of total), and Mobile and Client Business Unit also delivered $7.7 billion (32% of total). Core Data Center Business Unit added $5.7 billion (24%), and Automotive and Embedded Business Unit contributed $2.7 billion (11%).
Q2 FY2026 Segment Revenue ($B)
CMBU (Cloud)              : 7.7
CDBU (Core Data Center)   : 5.7
MCBU (Mobile and Client)  : 7.7
AEBU (Auto and Embedded)  : 2.7
Total                     : 23.8
That every single business unit hit a record in the same quarter is unusual.
It tells you