
Samsung Electronics - Fundamental Analysis Report 2026 (Updated)

Dear Readers, Welcome to Deep Research Global.
Let’s analyze the topic in detail.
Executive TL;DR
Samsung delivered the largest single-quarter profit in its history in Q1 2026, with consolidated revenue of KRW 133.9 trillion and operating profit of KRW 57.2 trillion (a 756% year-over-year jump), driven almost entirely by an AI-memory super-cycle and the first commercial shipments of HBM4 for NVIDIA’s Vera Rubin platform.
The Device Solutions (DS) division printed KRW 53.7 trillion of operating profit at a 66% margin, with memory alone delivering KRW 74.8 trillion of revenue (+292% YoY) on AI-driven pricing and a structural DRAM shortage.
Samsung’s market capitalization crossed $1 trillion on May 6, 2026, as the KOSPI broke 7,000 for the first time, but consensus 12-month price targets imply continued upside given the still-low single-digit P/E if 2026 earnings are annualized at anywhere near the Q1 run-rate.
Key catalysts for the next 12 months: HBM4/HBM4E ramp with NVIDIA and AMD, the second-generation 2nm GAA ramp at Samsung Foundry, Galaxy S26 cycle, and Samsung Display’s exclusive supply of OLED panels to Apple’s first foldable iPhone in late 2026.
Recommended - Read Full Reports


Read All Reports
Table of Contents
Executive TL;DR
Introduction
Samsung Electronics Company Profile: Key Facts Snapshot
Samsung Investment Thesis
Pillar 1
Pillar 2
Pillar 3
Samsung Business Model Overview
Vertical Integration Across the Tech Stack
Horizontal Diversification Across End Markets
The Components Flywheel
Samsung Revenue Analysis
Headline Numbers
Revenue Mix by Segment
Why the Memory Print Was So Large
Latest Quarterly Earnings, Guidance, and Margin Quality
Earnings Quality Assessment
Guidance Mechanics
EPS Trajectory
Cash Flow Mechanics and Capital Allocation
Cash Generation
Capital Expenditure Plan
Shareholder Returns
Balance Sheet Health and Financial Flexibility
Why This Matters Strategically
Segment-by-Segment Teardown
Segment 1: Device Solutions (DS) — Memory
Product Mix
HBM Competitive Position
AMD Partnership
Segment 2: Device Solutions (DS) — Foundry and System LSI
Utilization and Margin Inflection
Tesla AI6 Contract
Exynos 2600 and System LSI
Segment 3: Mobile Experience (MX) and Networks
Galaxy S26 Cycle
Margin Pressure From Internal Memory Pricing
Networks
Segment 4: Visual Display (VD) and Digital Appliances (DA)
TV Leadership
Digital Appliances Headwinds
Segment 5: Samsung Display (SDC)
Apple Foldable iPhone Catalyst
Segment 6: HARMAN
Sound United Integration
Strategic and Competitive Context
Memory: The Three-Way Race
Foundry: Catching TSMC Is Not the Goal
Mobile: The Premium Battle
Geopolitical Context
Valuation Framework
What the Multiples Say Today
Sum-of-the-Parts View
Why the Discount Persists
Bull Case, Base Case, and Bear Case
Bull Case
Base Case
Bear Case
Key Risks
Risk 1
Risk 2
Risk 3
Risk 4
Risk 5
Risk 6
Catalysts to Watch
Near-Term (Next 90 Days)
Medium-Term (Next 12 Months)
Longer-Term (12 to 24 Months)
My Final Thoughts
Latest Analyst Price Targets
Official Sources & Data
Disclaimer: This analysis is for informational & educational purposes only and should not be construed as investment advice. Investors should conduct their own due diligence and consult with their personal financial advisors before making investment decisions. Past performance does not guarantee future results.
Introduction
Just 12 months ago, the conventional view on Samsung Electronics among industry analysts was that the company had structurally lost the AI-memory race to SK Hynix, that its foundry was bleeding share to TSMC, and that its mobile division was running into a wall of rising bills of materials.
The Q1 2026 print rewrote almost all of that thesis in one quarter.
What I want to lay out in this report is not a celebration of a single quarter, but a fundamental teardown of whether the operating model that produced that quarter is durable, where the real points of fragility sit, and what an investor with a two-to-three year horizon should be watching from here.
The setup is unusually clean: a verifiable AI tailwind, a verifiable supply-side bottleneck in advanced memory and packaging, and a company that, after years of being doubted, has finally cleared its NVIDIA HBM3E qualification and is now shipping HBM4 commercially.
Samsung Electronics Company Profile: Key Facts Snapshot
Samsung Electronics is the flagship affiliate of the broader Samsung Group conglomerate and is the world’s largest manufacturer of memory chips, smartphones, and televisions by volume, and one of the world’s three leading semiconductor foundries.
The company is listed on the Korea Exchange (KRX) under ticker 005930.KS, with preferred shares under 005935.KS.
It is headquartered in Suwon, Gyeonggi-do, South Korea, with chip manufacturing campuses in Giheung, Hwaseong, Pyeongtaek, and Austin, Texas, and a new fab nearing completion in Taylor, Texas.
SAMSUNG ELECTRONICS CO., LTD. — KEY FACTS SNAPSHOT
-----------------------------------------------------------------------
Ticker (Common)         : 005930.KS (KOSPI)
Ticker (Preferred)      : 005935.KS
Founded                 : January 13, 1969
Headquarters            : Samsung Digital City, Suwon, South Korea
Executive Chairman      : Lee Jae-yong (Jay Y. Lee), since Oct 2022
Co-CEOs (2026)          : Han Jong-hee (DX), Jun Young-hyun (DS)
FY2025 Revenue          : KRW 333.6 trillion (~USD 225B equiv.)
FY2025 Operating Profit : KRW 43.6 trillion
Q1 2026 Revenue         : KRW 133.9 trillion (record)
Q1 2026 Op. Profit      : KRW 57.2 trillion (record, +756% YoY)
Net Cash (1Q26)         : KRW 119.24 trillion
Global Employees (2024) : ~267,800 across 74 countries
Major Brands            : Samsung, Galaxy, Bixby, SmartThings, HARMAN
Listing                 : KOSPI; ADRs traded OTC (SSNLF / SMSN.IL)
The group’s two reporting pillars are the Device Solutions (DS) division, which houses Memory, Foundry, and System LSI, and the Device eXperience (DX) division, which houses Mobile Experience (MX), Networks, Visual Display (VD), and Digital Appliances (DA).
Two separately consolidated subsidiaries, Samsung Display (SDC) and HARMAN International, round out the segment view.
The company is run on a dual-CEO structure that separates the appliance-and-device side from the components side, a governance choice that has, in practice, allowed the DS division to be reorganized aggressively under Jun Young-hyun while the DX division focuses on premiumization.
Samsung Investment Thesis
The 2026 investment case for Samsung Electronics is not a generic “tech recovery” story. It’s a very specific bet on three pillars stacking on top of each other at the same time.
Pillar 1: The Memory Super-Cycle Is Structural, Not Cyclical
The memory industry has experienced sharp boom-bust cycles roughly every three to four years since the 1990s.
What is different about 2025 and 2026 is that the demand driver is no longer enterprise IT refresh or smartphone replacement cycles, but training and inference workloads for generative AI, where every incremental NVIDIA Blackwell, Vera Rubin, or AMD Instinct GPU is paired with multiple stacks of HBM and an expanding pool of DDR5 in adjacent servers.
Samsung’s memory revenue hit $50.4 billion in Q1 2026 alone, a record for any memory supplier in any quarter in history.
DRAM and NAND ASPs are rising in tandem because lead-edge fab capacity is being absorbed by HBM, leaving conventional DRAM in structural shortage through at least the second half of 2026.
WHY THIS MEMORY CYCLE IS DIFFERENT
- HBM consumes ~3x the wafer area of equivalent-bit conventional DRAM
- Every HBM bit shipped removes ~3 bits of conventional DRAM capacity
- AI inference is now driving DDR5 server demand independently
- Three suppliers (Samsung, SK Hynix, Micron) control >95% of HBM
- China cannot fabricate competitive HBM under current export controls
Pillar 2: Foundry Has Inflected From Loss-Maker to Strategic Asset
For five consecutive years, Samsung Foundry was the segment that investors had to apologize for.
That changed in 2025.
Foundry utilization exceeded 80% in Q1 2026 for the first time in over a year, and Samsung has publicly committed to double-digit foundry revenue growth in 2026 on the back of 30%+ growth in 2nm orders.
The $16.5 billion Tesla AI6 contract, confirmed by Elon Musk in July 2025 and running through 2033, is the most visible anchor.
Less visible but equally important is the fact that Samsung’s S.LSI division has, for the first time in years, fielded a competitive in-house application processor. The Exynos 2600 is the world’s first 2nm-class smartphone SoC in production, and it powers a meaningful portion of the Galaxy S26 lineup.
Pillar 3: The Conglomerate Discount Is Real and Closing
Samsung trades at a meaningful discount to a sum-of-the-parts of its memory, foundry, mobile, display, and HARMAN businesses.
That discount existed for legitimate reasons (governance overhang, capital allocation concerns, foundry losses), but the picture is shifting.
The Lee family has sold down 17.7 million shares by April 2026 to cover inheritance-tax obligations, removing a long-standing overhang. The company is now in the final year of a three-year shareholder-return commitment to return 50% of free cash flow to shareholders.
Samsung Business Model Overview
Samsung’s business model is best understood as a vertically and horizontally integrated platform that captures value at every layer of the modern electronics stack, from silicon wafers and display glass through finished consumer devices and automotive infotainment systems.
Vertical Integration Across the Tech Stack
In a single Galaxy S26 Ultra, Samsung supplies the OLED panel through Samsung Display, the application processor in many regions through System LSI’s Exynos line, the DRAM and NAND through its own Memory division, and the camera image sensors (ISOCELL) through its sensor business. The finished device is then sold by the MX division. Few companies in the world operate this kind of stack.
This integration carries two implications that matter for investors.
First, when end-demand for premium devices is strong, Samsung captures margin at multiple layers simultaneously.
Second, when one segment is structurally short, as memory is today, the company can use its own internal demand to flex its merchant strategy without losing a captive customer.
Horizontal Diversification Across End Markets
Samsung’s diversification spans five end markets: mobile, computing (DRAM, SSD, foundry), data center (HBM, server DRAM, enterprise SSD), consumer durables (TV, appliances), and automotive (HARMAN, automotive OLED, automotive memory).
The result is that no single end market accounts for more than roughly a third of consolidated revenue in normal years.
SAMSUNG END-MARKET EXPOSURE (approximate, 2025 mix)
- Mobile devices & networks         : ~35%
- Memory components                  : ~25%
- Visual display & home appliances   : ~15%
- Display panels (SDC)               : ~8%
- Foundry & System LSI               : ~8%
- HARMAN (automotive + audio)        : ~5%
- Other                              : ~4%
The Components Flywheel
The strategic logic behind Samsung’s heavy capital expenditure is what executives internally describe as a components flywheel.
Cash generated from components funds the next generation of process technology; superior process technology produces higher-margin components; higher-margin components fund the next R&D cycle.
Samsung’s record KRW 37.7 trillion R&D spend in 2025, up 7.8% year over year, and its KRW 110+ trillion combined capex-and-R&D plan for 2026 are the financial expression of that flywheel.
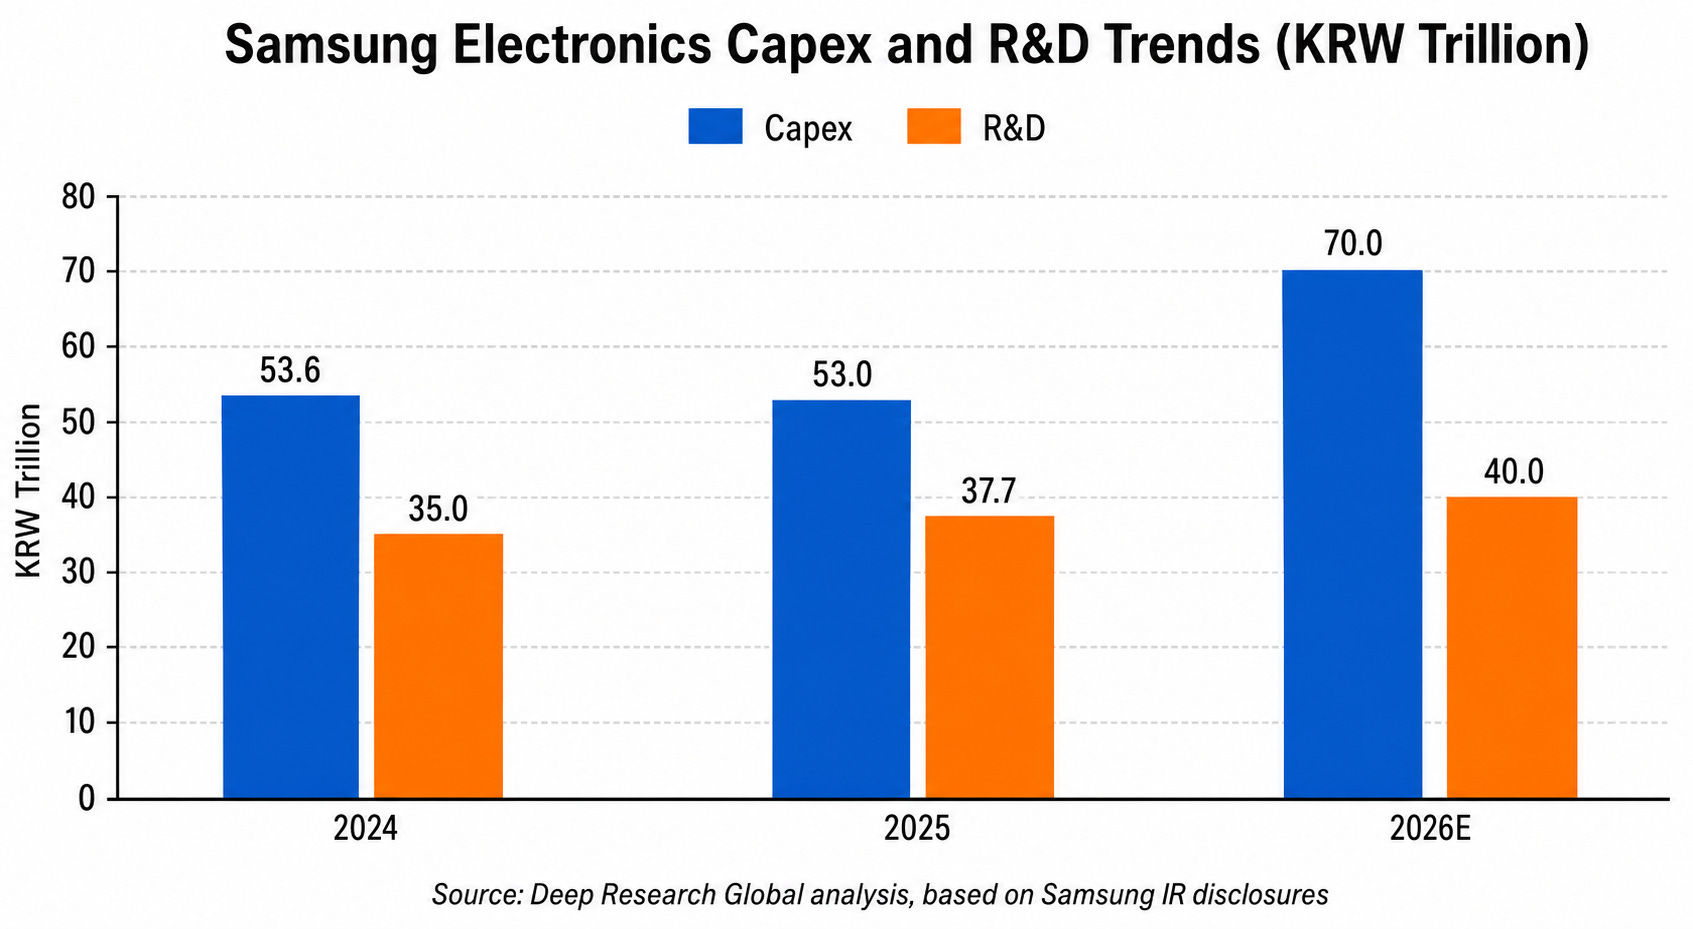
Image source: Deep Research Global analysis, based on Samsung Electronics annual reports.
Samsung Revenue Analysis: A Forensic Look at Q1 2026
The Q1 2026 result is so unusual that it deserves a detailed teardown rather than a generic summary.
Headline Numbers
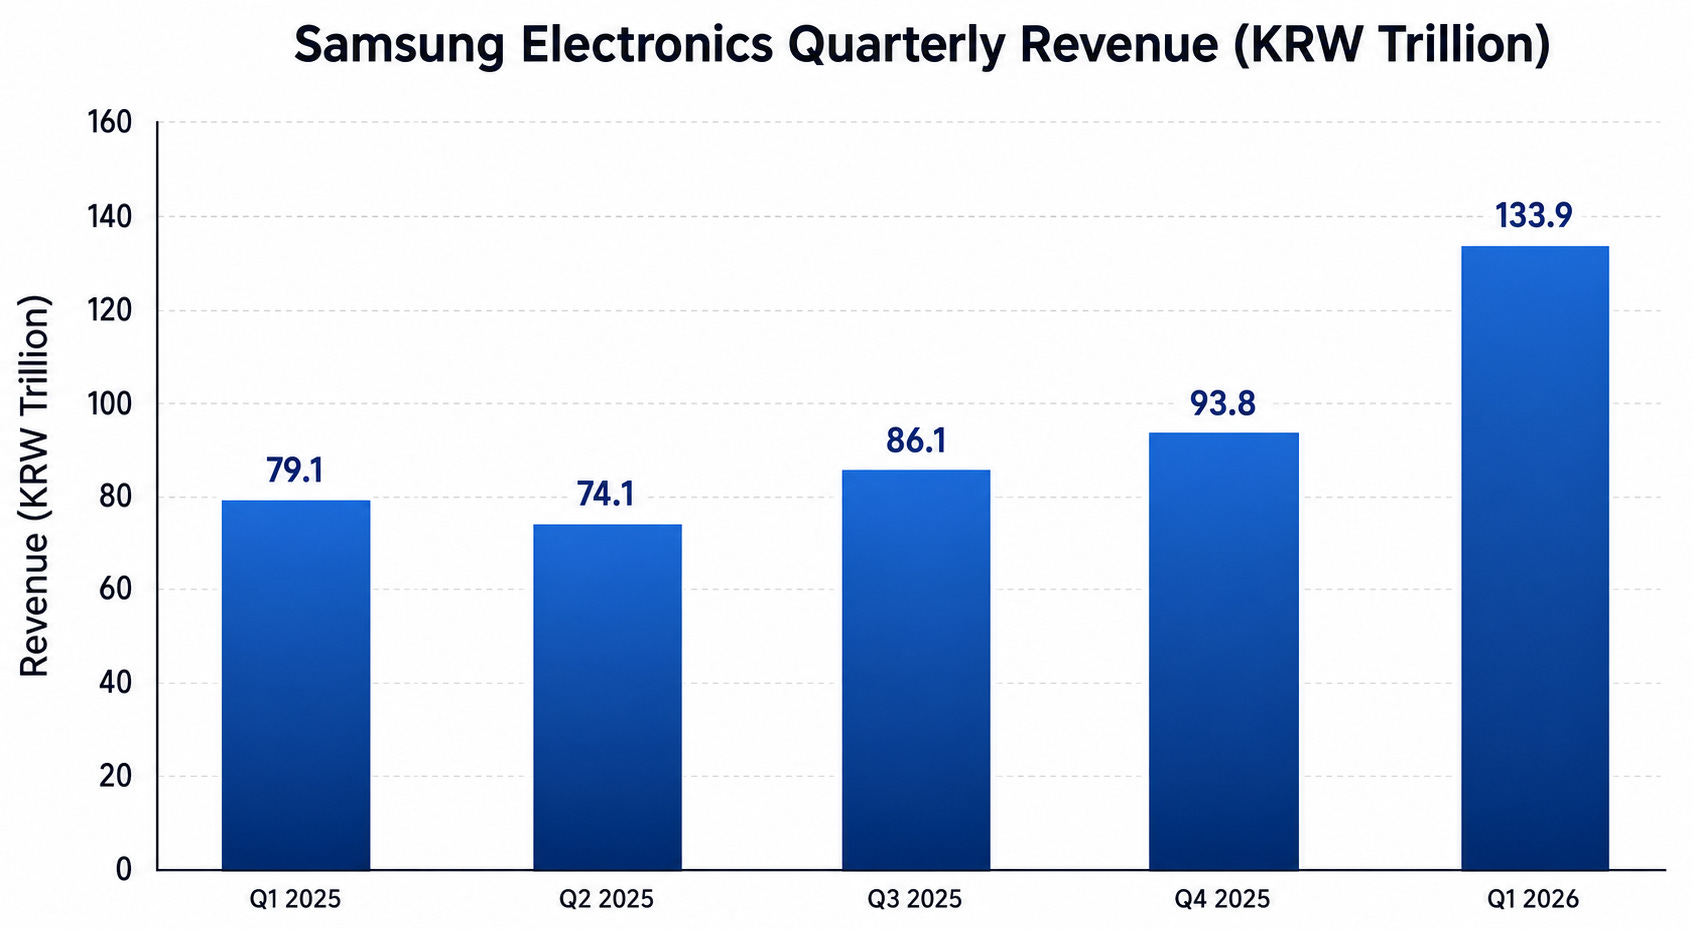
Image source: Deep Research Global analysis, based on Samsung Investor Relations quarterly earnings releases.
Consolidated revenue of KRW 133.9 trillion grew 69% year over year and 43% sequentially.
Operating profit of KRW 57.2 trillion grew 756% year over year and 185% sequentially, producing an operating margin of 42.8%, a level Samsung has not reported since the prior memory super-cycle in 2017-2018, and arguably never reported at this absolute scale.
Net profit of KRW 47.2 trillion implies a net margin of 35.3%. Return on equity of 41% and an EBITDA margin of 51% sit at the top end of what any consumer-electronics-plus-semiconductor conglomerate has historically printed.
SAMSUNG Q1 2026 HEADLINE KPIs
Metric                     Value
-------------------------  --------------------------
Revenue                    KRW 133.9 trillion
Operating Profit           KRW 57.2 trillion
Operating Margin           42.8%
Net Profit                 KRW 47.2 trillion
Net Margin                 35.3%
EBITDA Margin              51%
ROE                        41%
R&D Investment             KRW 11.3 trillion (+26% YoY)
Capex (PP&E purchases)     KRW 17.13 trillion
Net Cash KRW 119.24 trillionRevenue Mix by Segment
DS Memory contributed KRW 74.8 trillion (+292% YoY), DS Foundry and S.LSI added roughly KRW 6.9 trillion, MX/Networks delivered KRW 38.1 trillion (+3% YoY), VD/DA contributed KRW 14.3 trillion (-1% YoY), Samsung Display added KRW 6.7 trillion (+14% YoY), and HARMAN delivered KRW 3.8 trillion (+12% YoY).
The signal in the mix is that essentially the entire incremental growth came from the memory line.
Mobile was flattish, appliances were slightly down, and display and HARMAN moved at low-teens growth that is more representative of the underlying market.
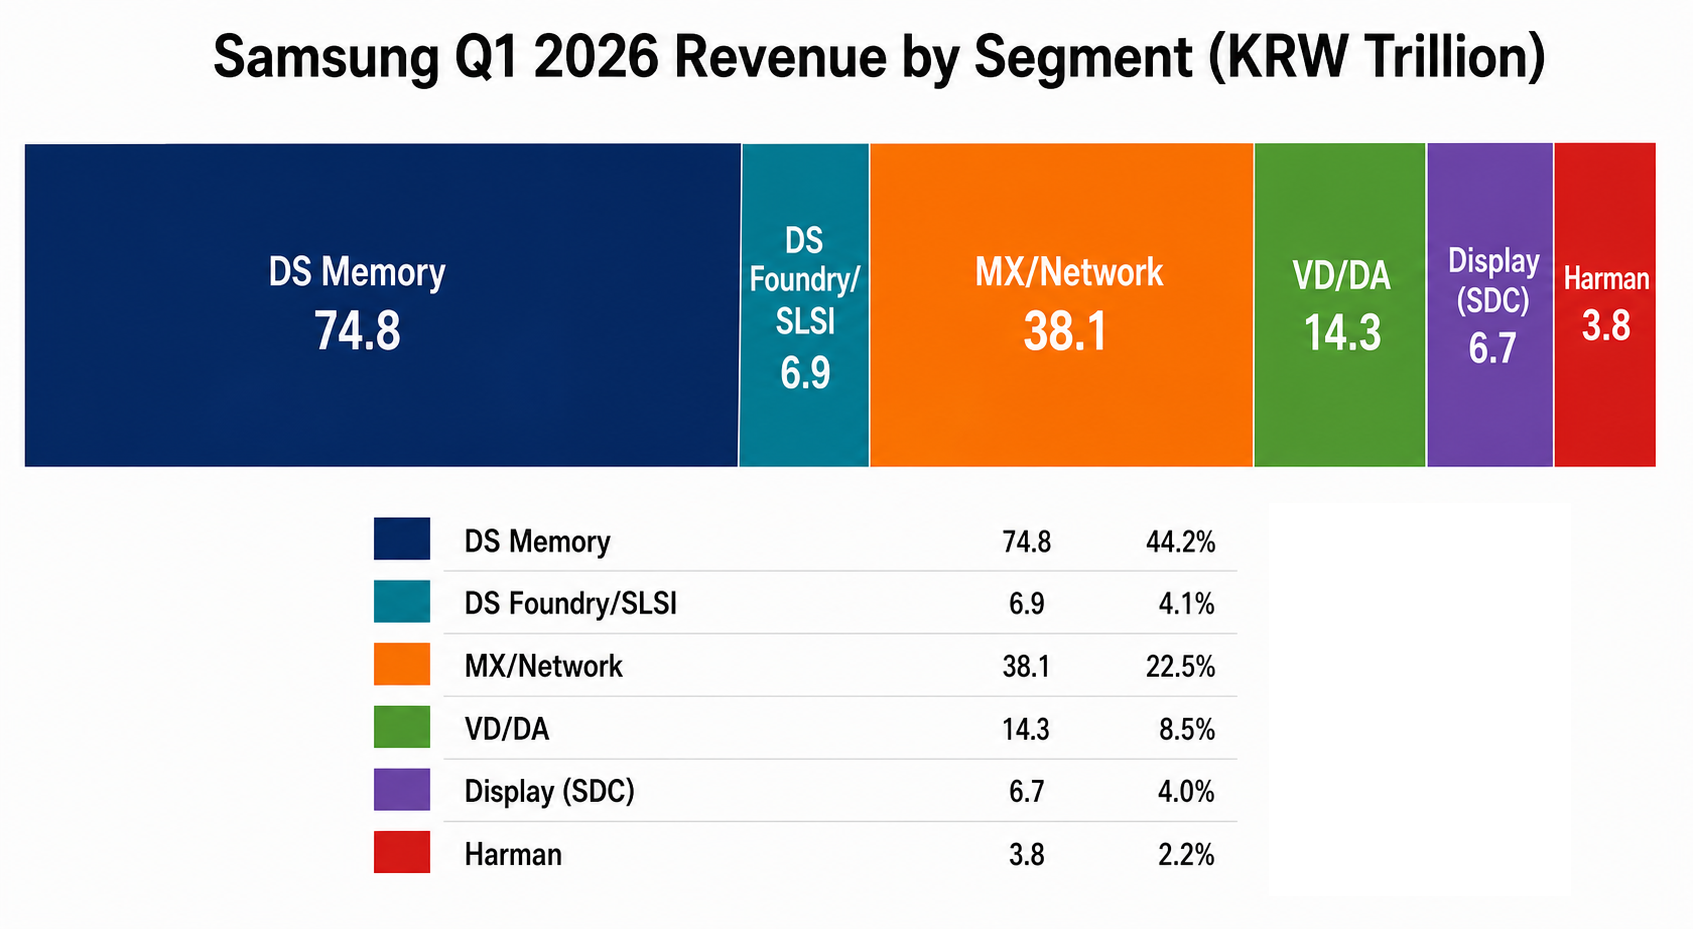
Image source: Deep Research Global analysis, based on Samsung Q1 2026 earnings disclosures.
Why the Memory Print Was So Large
Three things stacked on top of each other in the same quarter.