
Nvidia (NVDA) - Fundamental Analysis Report 2026 (Updated)

Dear Readers, Welcome to Deep Research Global.
Let’s analyze the topic in detail.
Executive TL;DR
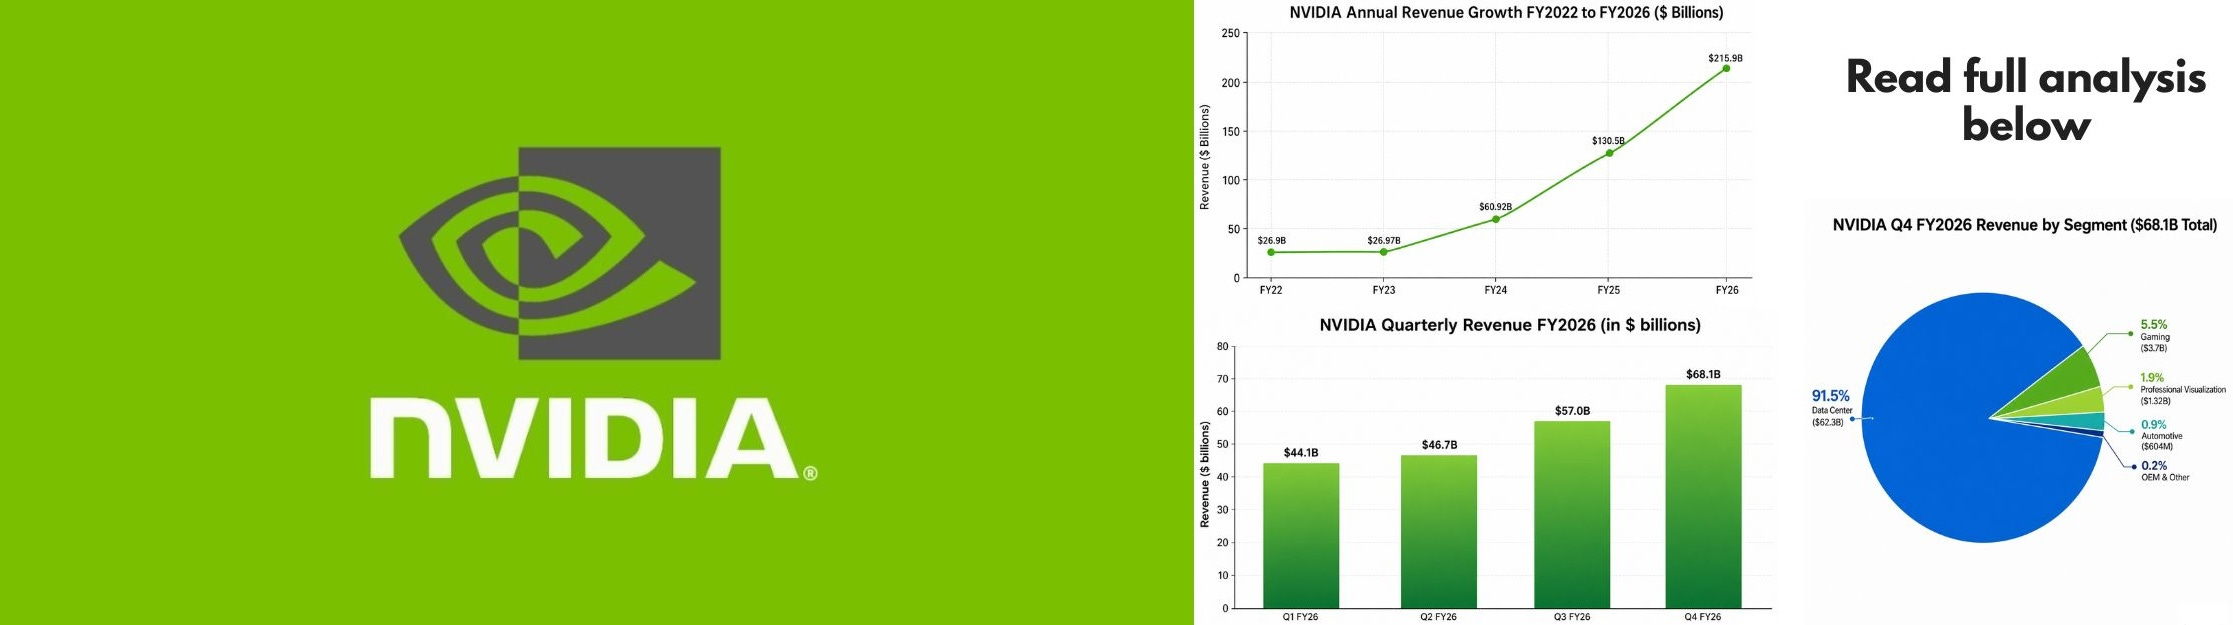
Nvidia (NVDA) closed fiscal 2026 with record revenue of $215.9 billion, up 65% year over year, and follows it with a Q1 FY2027 print of $81.6 billion in revenue, up 85% from a year ago.
Data Center is now 91.5% of the mix, hitting $62.3 billion in Q4 FY26 and $75.2 billion in Q1 FY27, while GAAP gross margins have recovered to 75% at the company level.
Full-year free cash flow was approximately $96.7 billion in FY26, with $41.1 billion returned to shareholders via buybacks and dividends and an $80 billion buyback authorization added.
The bull case rides Blackwell Ultra plus the Vera Rubin platform into 2027. The bear case centers on customer concentration, hyperscaler custom silicon, and China export risk.
Recommended - Read Full Reports


Read All Reports
Table of Contents
Executive TL;DR
Introduction
Nvidia Company Profile: Key Facts Snapshot
Nvidia Investment Thesis
The platform argument
The capital cycle argument
The sovereign argument
What could break the thesis
Nvidia Business Model Overview
Hardware revenue and software lock-in
Systems and rack-scale architecture
Software and recurring revenue
Capital allocation and partnerships
Nvidia Revenue Analysis
Annual revenue trajectory
Quarterly cadence in FY2026
Q1 FY2027 inflection
Geographic distribution
Latest Quarterly Earnings, Margins, and Earnings Quality
Q4 FY26 deep dive
Operating leverage and operating margin
Earnings quality and cash conversion
EPS Trajectory
Cash Flow Mechanics
Operating and free cash flow
Working capital dynamics
Capex intensity
Capital return
Balance Sheet Health
Debt position
Off-balance-sheet commitments
Strategic investments
Segment by Segment Teardown
Data Center
Compute sub-segment
Networking sub-segment
Gaming
Professional Visualization
Automotive
OEM and Other
Strategic and Competitive Context
The product roadmap
The hyperscaler ASIC threat
AMD
Other competitors
The software moat
Valuation Framework
Earnings-based framework
Free cash flow framework
Sum of the parts
Reverse DCF observation
Bull, Base, and Bear Case Scenario Analysis
Bull case
Base case
Bear case
Key Risks
Risk 1
Risk 2
Risk 3
Risk 4
Risk 5
Risk 6
Catalysts to Watch
Catalyst 1
Catalyst 2
Catalyst 3
Catalyst 4
Catalyst 5
Catalyst 6
Capital Allocation and Shareholder Returns
Buybacks
Dividends
Strategic investments
M&A approach
Management and Governance
ESG and Sustainability Considerations
My Final Thoughts
Collection of Latest Analyst Price Targets
Official Sources and Data
Disclaimer: This analysis is for informational & educational purposes only and should not be construed as investment advice. Investors should conduct their own due diligence and consult with their personal financial advisors before making investment decisions. Past performance does not guarantee future results.
Introduction
Nvidia just printed a quarter that almost defies normal corporate outlook.
Revenue of $81.6 billion in a single three-month window, gross margins back to a 75% handle, and a free cash flow base that lets management buy back stock at the pace of a mid-cap company every quarter without flinching.
For investors trying to decide whether to own, trim, or accumulate NVDA in mid-2026, the question is no longer whether the AI build-out is real.
It clearly is.
The question is whether Nvidia’s economics survive the next phase: Rubin shipments, hyperscaler ASIC pressure, and a maturing capex cycle inside its top ten customers.
Let’s analyze everything.
Nvidia Company Profile: Key Facts Snapshot
Nvidia Corporation, traded under the ticker NVDA on the Nasdaq, is the dominant designer of accelerated computing platforms.
The company was founded in 1993 by Jensen Huang, Chris Malachowsky, and Curtis Priem, and its first GPU in the modern sense was the GeForce 256 released in 1999.
Headquartered in Santa Clara, California, Nvidia today is structured around two reporting segments: Compute & Networking, and Graphics.
The Compute & Networking segment is where AI accelerators, networking switches, and DGX systems live, and it has become the engine behind essentially all of Nvidia’s recent growth.
NVIDIA Corporation (NVDA) – Snapshot (Fiscal 2026)
--------------------------------------------------
Headquarters         : Santa Clara, California
Founded              : 1993
CEO                  : Jensen Huang
Fiscal Year End      : Last Sunday of January
Reporting Segments   : Compute & Networking, Graphics
FY26 Revenue         : $215.9 billion
FY26 Net Income      : $117.0 billion (GAAP)
FY26 Free Cash Flow  : ~$96.7 billion
Shareholder Return   : $41.1 billion (FY26 buybacks + dividends)
Latest Quarter (Q1 FY27): $81.6 billion revenue, +85% YoY
The company’s revenue mix has shifted dramatically over five years.
Gaming, which was a majority of revenue as recently as fiscal 2021, is now roughly 5% of the business.
Data Center, which crossed 50% only in fiscal 2023, now accounts for 91.5% of revenue.
Nvidia’s headcount has also expanded substantially to support its expanding software, networking, and systems portfolios, although it remains lean per dollar of revenue compared with most semiconductor peers. The company’s revenue per employee is among the highest in any sector of the public market.
Cash and short-term investments stood at approximately $62.6 billion at fiscal 2026 year-end, giving Nvidia significant optionality for buybacks, dividends, strategic investments, and partnership commitments.
Meanwhile, net debt is meaningfully negative.
Nvidia Investment Thesis
The simple version of the Nvidia investment thesis is that accelerated computing is replacing general purpose computing, and Nvidia is the platform of record for that replacement.
For a detailed view, every investor needs to understand why the company’s combination of silicon, networking, and software has stayed durable for almost a decade.
In my opinion, these are the key investment thesis for Nvidia in 2026.
The platform argument
Nvidia is not just selling chips. It’s selling rack-scale computers with networking, system software, developer tools, and a library catalog (CUDA, cuDNN, TensorRT, NCCL, RAPIDS, NIM microservices) that spans roughly two decades of investment.
That platform is reinforced every year because the company iterates on hardware faster than competitors, and ships software updates that increase the performance of already deployed systems.
Customers who buy a Blackwell rack today see meaningful throughput improvements simply from CUDA updates over the system’s useful life.
The Nvidia Platform Stack (FY2026)
-----------------------------------
Silicon       : Blackwell (B200, B300/Ultra), Hopper (H200, H20)
Networking    : NVLink 5, Spectrum-X Ethernet, Quantum-X InfiniBand
Systems       : DGX SuperPOD, GB200 NVL72, GB300 NVL72
Software      : CUDA, cuDNN, TensorRT-LLM, NIM, Nemo
Services : DGX Cloud, AI Enterprise, Omniverse CloudThe capital cycle argument
For investors, the second leg of the thesis is that hyperscaler capex is not slowing.
Microsoft, Alphabet, Amazon, Meta, and Oracle together committed hundreds of billions in AI infrastructure spending across 2025 and 2026, with a meaningful portion routed to Nvidia systems either directly or through neo-clouds like CoreWeave and Lambda.

Nvidia has chosen to invest some of its own balance sheet into the demand it benefits from.
The company announced a letter of intent with OpenAI to deploy at least 10 gigawatts of Nvidia systems, with potential Nvidia investment of up to $100 billion in the venture.
The sovereign argument
The third leg is sovereign AI.
Countries are now buying Nvidia hardware the way they buy infrastructure for power grids or telecom backbones.
Saudi Arabia’s new AI champion HUMAIN partnered with Nvidia to deploy hundreds of thousands of GPUs, and the UAE’s G42 secured advanced Nvidia chip access in a separate U.S. approved arrangement.
This matters because sovereign demand is structurally less cyclical than enterprise IT spending.
Governments do not buy a quarter at a time. They commit to multi-year national programs.
What could break the thesis
The thesis breaks if any of the following happen with conviction.
Hyperscaler custom silicon (Google TPU, Amazon Trainium, Microsoft Maia, Meta MTIA) absorbs more than half of incremental AI training workload growth from 2027 onward.
Or model architecture shifts away from the dense transformer designs that favor Nvidia’s interconnect-heavy approach.
Or the U.S. and China reach a sustained, expansive export-control regime that prices Nvidia out of a market that historically accounted for 17% to 20% of revenue.
Each of these is a real possibility.
But none of them is the consensus base case at the time of this analysis.
Nvidia Business Model Overview

Nvidia operates a fabless semiconductor model.
The company designs chips and systems, partners with foundries like TSMC for manufacturing, and partners with system integrators (Supermicro, Foxconn, Wistron, Dell, HPE, Lenovo, ASUS) for assembly.
The intellectual property and the orchestration sit inside Nvidia.
Hardware revenue and software lock-in
The bulk of revenue today is hardware. AI accelerators like the H100, H200, B200, GB200, and GB300 generate the dollars.
But the customer’s willingness to pay a premium price for that hardware is driven by software.
CUDA and the surrounding library stack are essentially impossible to replicate without rewriting model code, retesting kernels, and accepting potential regressions in production.
This is the famous CUDA moat.
This ecosystem represents two decades of accumulated developer mindshare and is one of the principal reasons margins have stayed at 75% despite a market full of alleged challengers.
Systems and rack-scale architecture
Nvidia has progressively moved from selling chips to selling racks.
The GB200 NVL72, a 72-GPU liquid-cooled rack with NVLink switching, is the unit of measure for modern AI factories.
Hyperscalers reportedly deployed nearly 1,000 NVL72 racks per week on average at peak Blackwell ramp.
Selling at the rack level matters for two reasons.
It increases the dollar content per customer order.
And it forces competitors to match Nvidia not just on chip performance but on system integration, cooling, and networking, where the bar is materially higher.
Why Selling Racks Matters
-------------------------
1. Per-unit revenue capture rises from ~$30k (single GPU) to roughly $3M+ per NVL72 rack.
2. Integration risk shifts to Nvidia, which raises the price the customer is willing to pay for a turnkey solution.
3. Networking attach (NVLink, Spectrum-X) becomes part of the same purchase order, lifting segment margins.
4. Competitors must replicate hardware AND topology AND software to win against a single rack reference design.Software and recurring revenue
The third revenue layer is software, including Nvidia AI Enterprise, Omniverse, and DGX Cloud.
Software remains a single-digit percentage of total revenue but is growing quickly, and its strategic value exceeds its current dollar contribution because it makes the next hardware refresh harder to skip.
Nvidia has been increasingly explicit about ambitions for a recurring software revenue stream layered on top of the GPU business.
The company prices DGX Cloud instances at premium per-month tiers and bundles AI Enterprise licenses with enterprise hardware deals.
Capital allocation and partnerships
Nvidia also operates an unusual hybrid model in which it invests in customers and ecosystem partners.
The company has positioned itself as a sponsor of certain neo-cloud businesses, taken stakes in AI software companies, and signed multi-year prepay agreements with select foundries to lock in capacity.
This blurs the line between supplier, investor, and ecosystem orchestrator.
Nvidia Revenue Analysis
Nvidia’s revenue trajectory over the last five fiscal years is one of the steepest in the history of public markets at this scale.
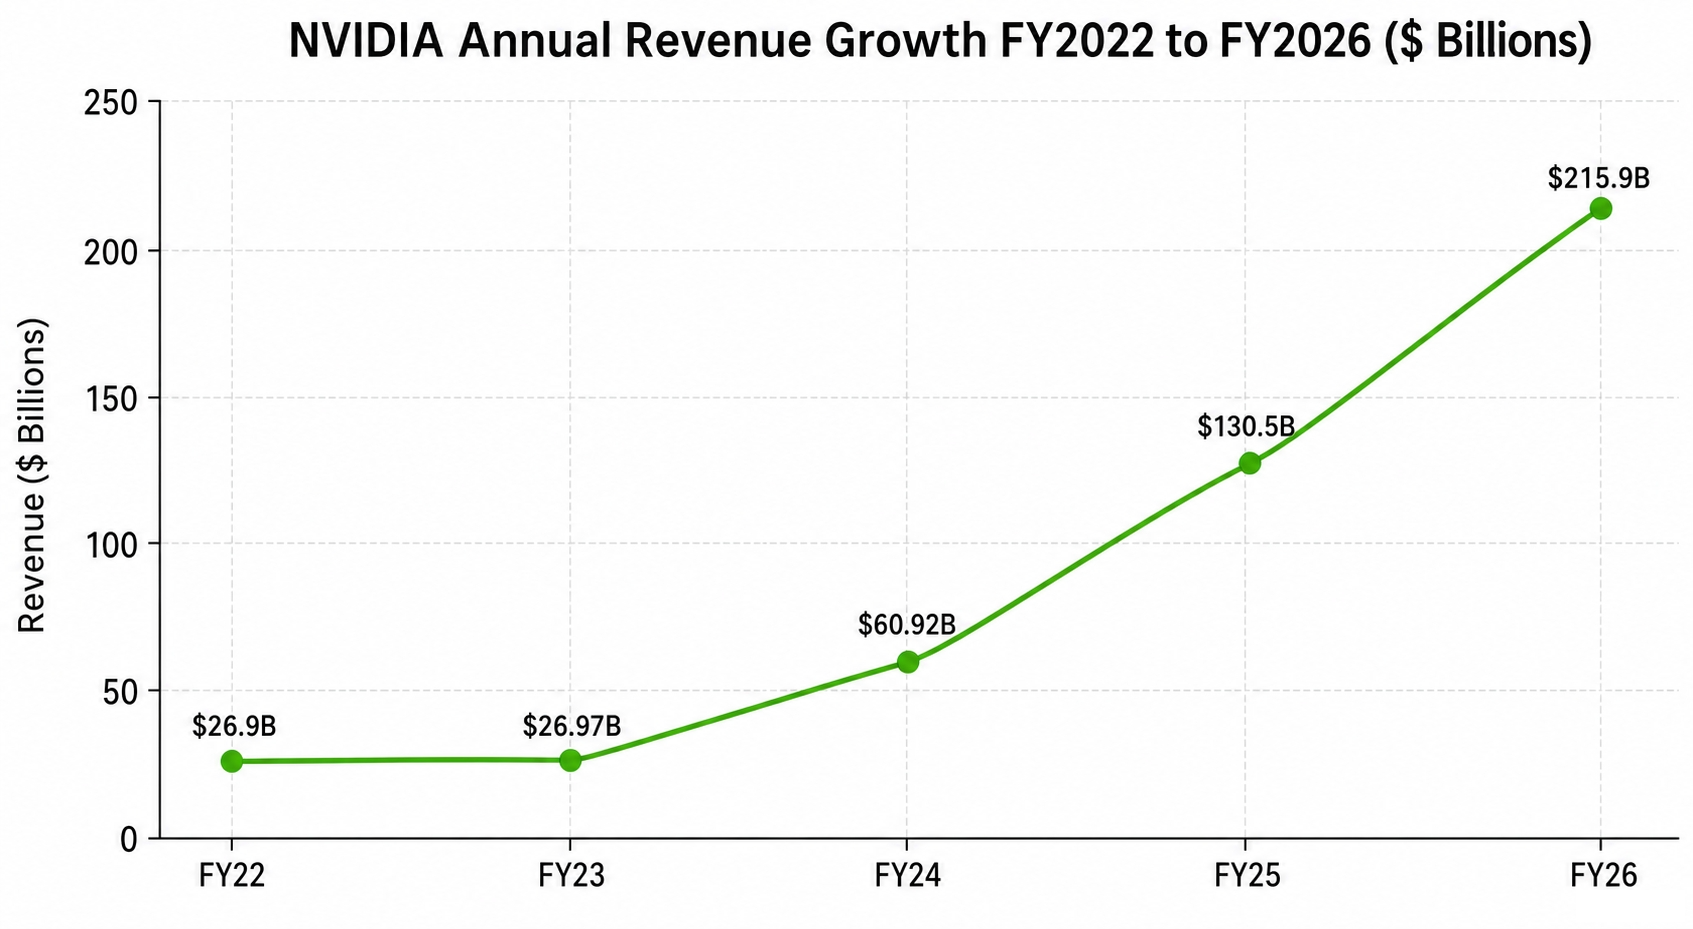
Image source: Deep Research Global analysis, based on NVIDIA official financial reports.
Annual revenue trajectory
Fiscal 2022 revenue was approximately $26.9 billion. Fiscal 2026 revenue closed at $215.9 billion, an increase of more than 8x in four years. The compound growth rate over that period is in excess of 68%.
What stands out beyond the rate of growth is the acceleration in absolute dollars.
Fiscal 2025 added roughly $69 billion of revenue versus FY24. Fiscal 2026 added another $85 billion versus FY25.
Thus, the company is growing faster on a larger base.
Quarterly cadence in FY2026
The quarterly cadence in fiscal 2026 tells the same story.
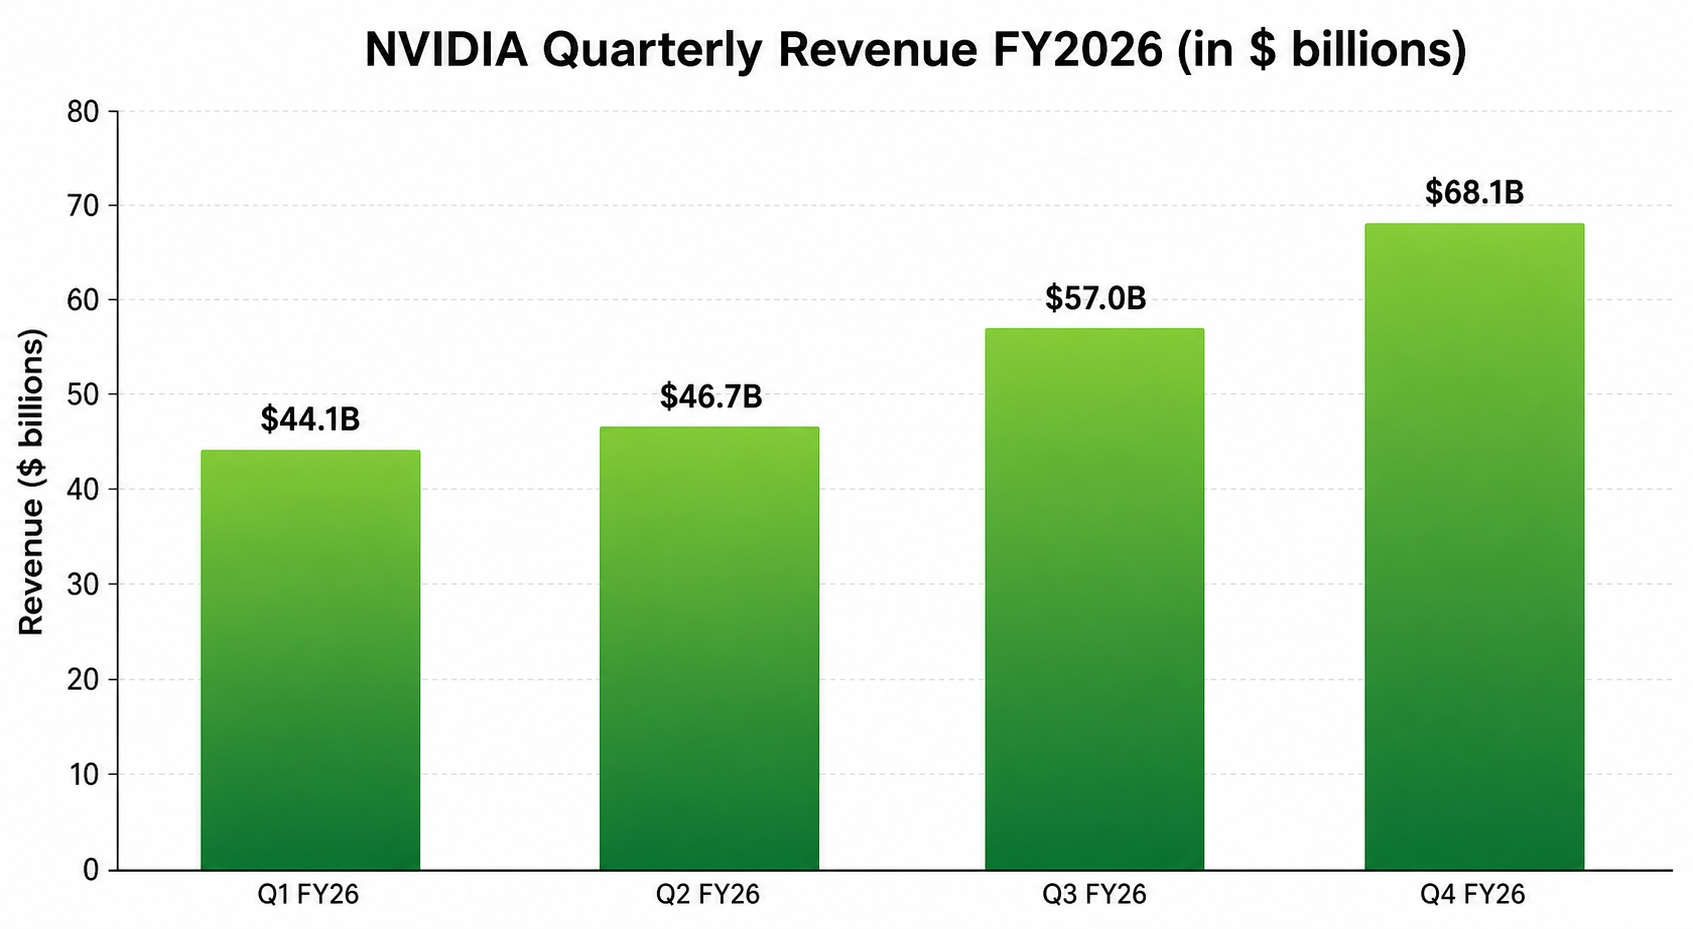
Image source: Deep Research Global analysis, based on NVIDIA official press releases.
Q1 FY26 revenue was $44.1 billion, up 69% year over year.
Q2 FY26 came in at $46.7 billion, up 56% YoY.
Q3 FY26 reached $57.0 billion, up 62% YoY.
Q4 FY26 closed at $68.1 billion, up 73% YoY.
Sequentially, the step from Q3 to Q4 was 20%. That kind of intra-year acceleration is rare for any company, let alone one with a full-year revenue base above $200 billion.
Q1 FY2027 inflection
Then came the most recent print.
Q1 FY27, the quarter ended April 26, 2026, delivered $81.6 billion in revenue, up 85% year over year and up 20% sequentially. Data Center revenue alone was $75.2 billion, up 92% from a year ago.
The headline EPS print for Q1 FY27 was $1.87 on an adjusted basis, beating the $1.77 consensus that had built up ahead of the release.
Quarterly Revenue Progression
-----------------------------
Q1 FY26 (Apr 2025): $44.1B
Q2 FY26 (Jul 2025): $46.7B
Q3 FY26 (Oct 2025): $57.0B
Q4 FY26 (Jan 2026): $68.1B
Q1 FY27 (Apr 2026): $81.6B
Geographic distribution
Geographic mix has shifted notably.